How to Measure 7 Types of Stress in Plants Using Leaf Spectroscopy
Dr. Vijayalaxmi Kinhal
September 25, 2023 at 3:45 pm | Updated April 15, 2026 at 2:55 am | 8 min read
- Leaf Spectroscopy can measure seven common stresses that crops encounter.
- The crop leaf stressors are drought, nutrient deficiency, temperature, pests, diseases, salinity, and herbicides.
- Spectral changes due to physiological, anatomical, and chemical alterations triggered by stress are used in its measurement.
- Various methods are visual, multispectral, hyperspectral, thermal imaging, and light interaction.
Yield depends on biomass accumulation and loss due to biotic and abiotic stresses. It is necessary to go beyond soil monitoring to feed a growing population and reduce the environmental impact of agrochemical use. Non-destructive plant-level sensors can provide accurate information in real-time about a crop’s response to the environmental conditions and stress that traditional methods cannot offer. A handheld leaf spectrometer can provide more details of various stresses.
Why is Leaf Spectroscopy Used to Measure Stress?
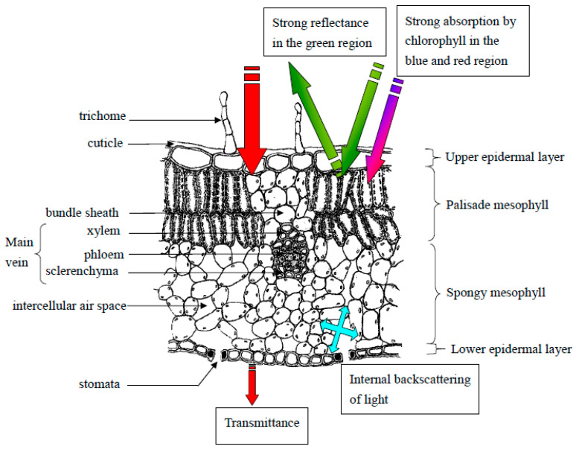
Figure 1: “Drawing of a cross-section of a typical leaf with labeled cell types and layers. Basic light interactions with leaf layers are annotated. Zubler and Yoon (2020). (Image credits: https://doi.org/10.3390/bios10120193)
Subscribe to receive our monthly round-up of articles.
Leaf spectroscopy can probe bio responses because many physiological, anatomical, and chemical plant properties affect how tissues absorb, reflect, or transmit light, see Figure 1.
The new portable spectroscopy-based tools use imaging or light interaction with the plant tissue, like absorbance, transmittance, reflectance, and fluorescence. These tools use various wavelength bands like the visible red-green-blue (RGB), near-infrared (NIR), infrared (IR), and ultraviolet (UV). Multispectral devices use many specific wavelengths, and hyperspectral ones use whole ranges of wavelengths to give information on stress. Chemometric models and deep learning techniques are combined with spectroscopy to estimate stress.
The plant properties involved in stress measurement are:
- Pigments: Production of leaf pigments, chlorophyll, carotenes, and xanthophylls, which are significantly involved in spectroscopy, change due to stress like nutrient deficiency or biotic stressors.
- Anatomy: Leaf anatomical properties, like cuticle thickness, surface texture, cell wall thickness, cell wall elasticity, epidermal cells’ convexity, and trichome density change due to stress and affect a leaf’s spectra.
- Biochemistry: Changes to leaf composition of cellulose, hemicellulose, protein, sugar, starch, and lignin, and their concentrations affect spectroscopy. Plants also produce chemicals to fight stress, which are detected with spectroscopy.
Changes to a leaf’s spectral response allow early crop stress detection due to nutrient deficiency, temperature, water, pests, diseases, salt, and herbicides.
-
Nutrient Deficiency Stress
It is possible to detect nutrient deficiency of macronutrients such as nitrogen, phosphorus, potassium, calcium, and magnesium and micronutrients like zinc, iron, and manganese. All macronutrient and micronutrient deficiencies reduce chlorophyll concentrations, leaf absorbance, and light transmittance, so the stress results in more reflectance in the visible, infrared, and near-infrared spectrum. Chlorophyll fluorescence is also used to measure nutrient deficiency.
A study on wheat found the red edge, which results from the absorbance of red by chlorophyll and reflectance in infrared, shifts depending on the element. There is a reduction in reflectance in the infrared zone when grown since the leaf structure is destroyed by stress.
However, where crops are grown can also be influential. Nitrogen and magnesium deficiency in wheat fields causes a shift towards 33% and 25% in the visible range and 86% and 53% in the infrared spectrum, respectively. In indoor conditions, wheat showed an increase in the reflectance by 97% and 25% in the visible range and by 20% and 30% in the infrared spectrum to nitrogen and magnesium deficiencies, respectively.
So, the growing environment and species will affect the spectral changes to nutrient element deficiency. Data processing by chemometrics is also necessary as the spectra due to each element’s deficiencies overlap.
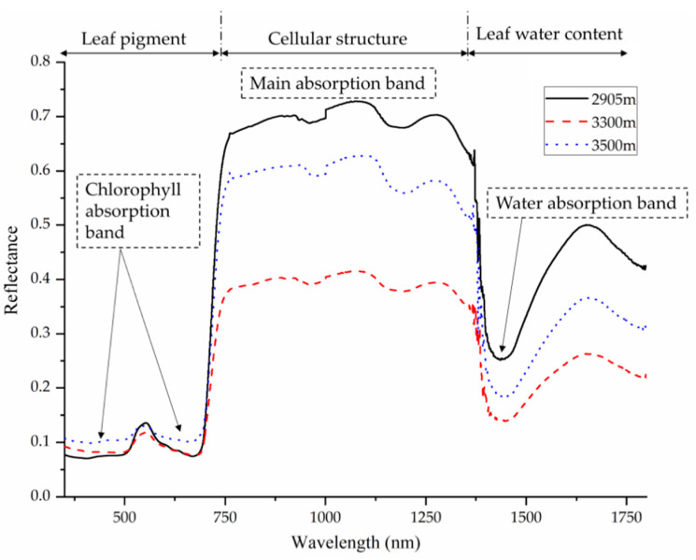
Figure 2: “Reflectance spectra of Quercus aquifolioides leaves at different altitudes. Vegetation reflectance curves, in general, typically display this kind of pattern, with low reflectance in the visible region (influenced by leaf pigments), “red edge” connecting the visible and near-infrared (NIR) region, and high reflectance in the NIR region (influenced by cell structure). After 1300 nm, reflectance characteristics are mostly influenced by leaf water content” Zubler and Yoon (2020). (Image credits: 10.3390/bios10120193).
-
Leaf Water Stress
Leaf water stress, caused by soil water deficiency, is one of the main factors affecting photosynthesis and plant productivity. Early prediction of leaf water stress can help provide irrigation before the water stress affects the plant too much. When leaves experience water stress, the guard cells grow flaccid and close the stomata, through which water vapor escapes. However, the stomata is the opening through which carbon dioxide fixed in photosynthesis enters leaves, so a decrease in stomatal conductance reduces photosynthesis. Leaf water content is also being used to guide fertilizer application.
Visible, infrared, and NIR wavelengths are helpful to find leaf water stress. Water absorbs light in the infrared region, and this interaction is used in water stress indices to find leaf water content, see Figure 2. Also, cell wall elasticity changes, and in some cases, cuticle thickness increases due to drought stress, which will also change leaf reflectance. Therefore, the precise wavelength for drought detection will differ for species; for example, it is 500-850 nm for maize, 430-890 nm for barley, and 400-980 nm for tomato. Non-linear models are more successful than linear models in analyzing leaf water content. Since there is genotypic plasticity, spectroscopy selects the cultivar to maintain higher leaf water content while breeding crops for drought resistance.
-
Temperature Stress
Plants can suffer from low temperature or cold stress and high temperature or heat stress. Infrared thermal imaging is standard to find canopy temperature.
Due to cold stress, plants synthesize reactive oxygen species (ROS), such as hydrogen peroxide. The plants respond by prioritizing the accumulation of antioxidants and enzymes to reduce ROS over water content. So, cold stress results in less leaf water content that can be detected in changes in infrared spectra. Therefore, several trees will respond to cold temperatures as they do to drought. They increase cuticle thickness and have less leaf water content.
Crops like wheat are sensitive to high temperatures, and it is predicted that for each Celsius degree rise, there will be a 6% loss in global yield. While the growth stage at which heat stress occurs is crucial, even a day’s heat stress can affect the plant productivity. Excessive heat will reduce leaf water content. However, even moderate heat alters the infrared region’s spectral response by changing plants’ bio composition by altering polysaccharides, lipids, hemicellulose, lignin, and pectin levels. Compounds like pectin and lignin are found in cell walls and could affect cell wall porosity.
-
Pest Stress
The chemicals plants produce as a bio response to pest attacks are used to measure pest stress. Portable spectroscopy-based tools help identify and detect stress before visual crop symptoms, like lesions, appear.
If used as part of Integrated Pest Management, early detection can help in decision-making to eradicate the pests before their population spikes. Leaf spectroscopy is a vital tool to deal with pests that have developed resistance to pesticides, like corn rootworms, without using chemicals.
Pests and diseases cause a global 20-30 percent loss of crop yield annually, and reducing these losses can improve food security without additional commitment of land or resources.
-
Disease Stress
Hyperspectral and multispectral imaging and fluorescence spectroscopy best measure disease stress. All diseases reduce chlorophyll and change fluorescence at 686 and 735 nm. Also, changes in phenolic compounds’ fluorescence at 530 nm can be used to detect disease stress.
Another approach is to identify the specific wavelengths associated with each plant disease. However, minor differences in the necessary wavelengths to identify the same pathogen in different crops should be expected. For example, detecting powdery mildew in wheat requires the 350–1350 nm range and 400–1000 nm band for barley by hyperspectral imaging.
A third and indirect pathogen stress detection method is estimating changes in spectra due to temperate rise. When pathogens like bacteria or viruses enter the stomata, the leaves recognize the microbe-associated molecular patterns and reduce stomatal conductance. Transpiration is a means to regulate leaf temperature, and closing stomata increases leaf temperature, which infrared wavelengths can detect.
Nowadays, it is also possible to identify and differentiate between simultaneously occurring stressors. If disease and nutrient deficiency happen in the same plant, it is possible to use green, blue, and yellow fluorescence in addition to red and infrared wavelengths to find stress. For example, powdery mildew and leaf rust infection were identified even in plants with nitrogen deficiency.
-
Salt Stress
Salinity affects nearly 20 percent of arable land and reduces plant growth and yield. New cultivars that can grow in this changed environment need to be developed. Instead of traditional methods, leaf spectroscopy is used for phenotyping salinity-tolerant traits to evaluate morphological, biochemical, and physiological parameters. Hyperspectral imaging can handle massive amounts of data supported by data analytics.
Salt stress changes spectral signatures by damaging mesophyll cells in leaves and altering cell wall bio composition in terms of polysaccharides and lignin. A few days of consistent salinity makes leaves darker due to chlorophyll accumulation that is easily spotted by pigment analysis by spectroscopy. Changes in chlorophyll, carotenoid, and water contents can be detected in the 380-1030 nm range. Water content in leaves reduces as water accumulates in the soil with higher salt content.
Salinity reduces the photosynthetic rate, followed by leaf senescence and a decrease in fresh weight, which spectroscopy can measure.
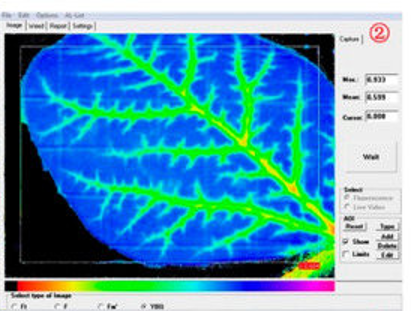
Figure 3: “The purple and blue pixels represent leaf area with higher Fv/Fm values, while the red pixels represent leaf area with lower Fv/Fm values. Blue color represents high Fv/Fm values and healthy tissues while the yellow and red color represents pixels with low Fv/Fm values and plant damage detected by the field chlorophyll fluorescence sensor” Li et al. 2018. (Image credits: https://doi.org/10.3390/s18010021)
-
Herbicide Stress
Controlling weeds using pre- and post-emergent chemical herbicides is standard procedure. Herbicide applications during rainfalls, low temperatures, unfavorable soil conditions, and improper timing, dose, and mixtures can harm crops. They can delay crop growth, damage crops, and ultimately reduce yield.
Farmers look for visual symptoms to check for herbicide effects. However, chlorophyll fluorescence can detect herbicide stress before it develops too long, enabling growers to adjust dosage and chemicals. Shortly after application, herbicides reduce light reactions of photosystems, and the difference in chlorophyll fluorescence can indicate herbicide stress, as shown in Figure 3.
Measuring Stress in the Field with Leaf Spectroscopy
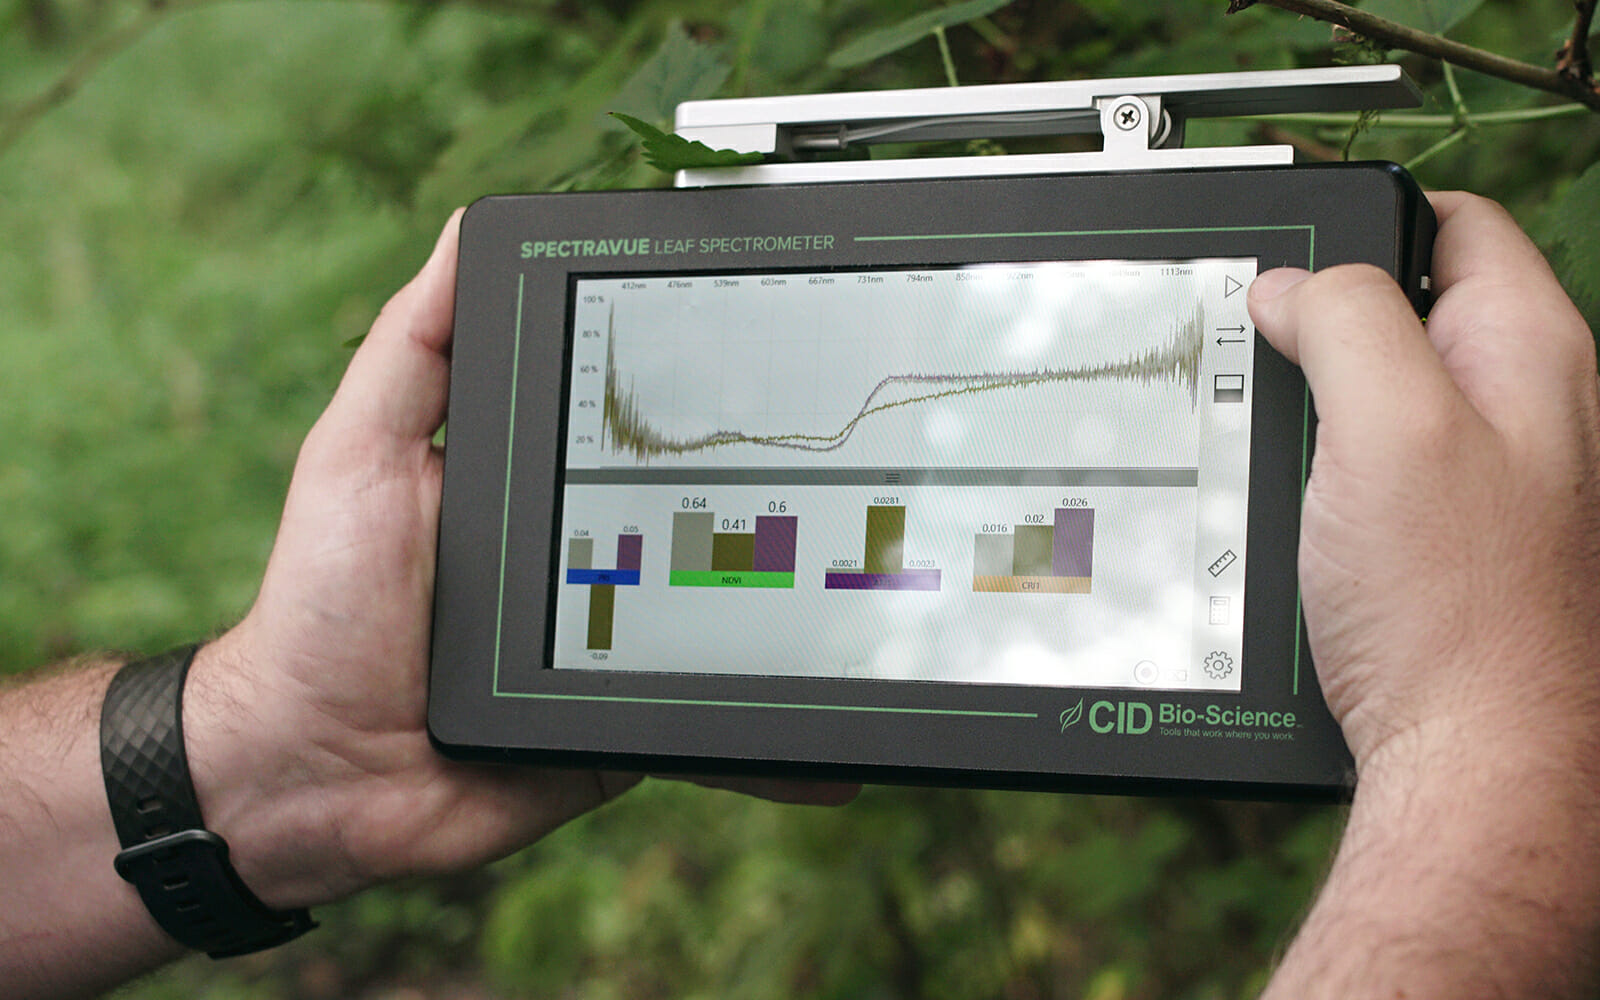
Remote application of leaf spectroscopy in precision agriculture is common. Nowadays, digital, thermal, multispectral, or hyperspectral cameras or spectrometers are getting miniaturized, cost-effective, and more precise and are providing a rapid field stress detection option. The CI-710s SpectraVue Leaf Spectrometer, from CID Bio Science Inc., is one tool farmers and scientists rely on for fast, non-destructive leaf stress measurement. It estimates light transmission, absorption, and reflection and uses inbuilt indices for pigment and nutrient analysis. Portable leaf spectrometers will be valuable in reducing crop yield losses as a sustainable, immediate, and practical solution to ensure food security without environmental damage.
Sources
Ayala-Silva, T., & Beyl, C. A. (2005). Changes in spectral reflectance of wheat leaves in response to specific macronutrient deficiency. Advances in Space Research, 35(2), 305–317. https://doi.org/10.1016/j.asr.2004.09.008
Buitrago, M. F., Groen, T. A., Hecker, C. A., & Skidmore, A. K. (2016). Changes in thermal infrared spectra of plants caused by temperature and water stress. ISPRS Journal of Photogrammetry and Remote Sensing, 111, 22–31. https://doi.org/10.1016/j.isprsjprs.2015.11.003
Bürling, K., Hunsche, M., & Noga, G. (2011). Use of blue–green and chlorophyll fluorescence measurements for differentiation between nitrogen deficiency and pathogen infection in winter wheat. Journal of plant physiology, 168(14), 1641-1648.
Behmann, J., Acebron, K., Emin, D.,… & Rascher, U. (2018). Specim IQ: evaluation of a new, miniaturized handheld hyperspectral camera and its application for plant phenotyping and disease detection. Sensors, 18(2), 441.
Chen, T., Zhang, J., Chen, Y., Wan, S., & Zhang, L. (2019). Detection of peanut leaf spots disease using canopy hyperspectral reflectance. Computers and electronics in agriculture, 156, 677-683.
Feng, X., Zhan, Y., Wang, Q., Yang, X., Yu, C., Wang, H., … & He, Y. (2020). Hyperspectral imaging combined with machine learning as a tool to obtain high‐throughput plant salt‐stress phenotyping. The Plant Journal, 101(6), 1448-1461.
Huang, C. H., Singh, G. P., Park, S. H., Chua, N.-H., Ram, R. J., & Park, B. S. (2020). Early diagnosis and management of nitrogen deficiency in plants utilizing Raman spectroscopy. Frontiers in Plant Science, 11. https://doi.org/10.3389/fpls.2020.00663
Jin, X., Shi, C., Yu, C. Y., Yamada, T., & Sacks, E. J. (2017). Determination of leaf water content by visible and near-infrared spectrometry and multivariate calibration in Miscanthus. Frontiers in Plant Science, 8. https://doi.org/10.3389/fpls.2017.00721
Li, H., Wang, P., Weber, J. F., & Gerhards, R. (2018). Early identification of herbicide stress in soybean (Glycine max (L.) Merr.) using chlorophyll fluorescence imaging technology. Sensors, 18(1), 21.
Osman, S.O.M., Saad, A.S.I., Tadano, S., et al. (2022). Chemical Fingerprinting of Heat Stress Responses in the Leaves of Common Wheat by Fourier Transform Infrared Spectroscopy. Int. J. Mol. Sci., 23, 2842. https://doi.org/10.3390/ijms23052842
Pacumbaba, R. O., & Beyl, C. A. (2011). Changes in hyperspectral reflectance signatures of lettuce leaves in response to macronutrient deficiencies. Advances in Space Research, 48(1), 32–42. https://doi.org/10.1016/j.asr.2011.02.020
Tomkiewicz, D., & Piskier, T. (2012). A plant-based sensing method for nutrition stress monitoring. Precision Agric 13, 370–383. https://doi.org/10.1007/s11119-011-9252-3
Zubler, A. V., & Yoon, J. Y. (2020). Proximal Methods for Plant Stress Detection Using Optical Sensors and Machine Learning. Biosensors, 10(12), 193. https://doi.org/10.3390/bios10120193
Related Products
Most Popular Articles
- Transpiration in Plants: Its Importance and Applications
- Leaf Area – How & Why Measuring Leaf Area…
- How to Analyze Photosynthesis in Plants: Methods and Tools
- Plant Respiration: Its Importance and Applications
- The Forest Canopy: Structure, Roles & Measurement
- Stomatal Conductance: Functions, Measurement, and…
- Forest & Plant Canopy Analysis – Tools…
- Root Respiration: Importance and Applications
- 50 Best Universities for Plant Science
- The Importance of Leaf Area Index (LAI) in…