Your data through a new lens
The CID Bio-Science Plant Canopy Imager makes data collection a breeze, allowing you to focus on the metrics that matter.
Crop optimization
Measure vegetative spectral response, estimate plant nutrition, water requirements, and plant stress to enhance crop yields.Forest productivity
LAI, PAR and sunflecks inform silviculture, forest restoration, and the optimization of yields and wood quality.Environmental research
Use canopy data to develop a greater understanding of the impacts of climate change, and human activity on the natural world.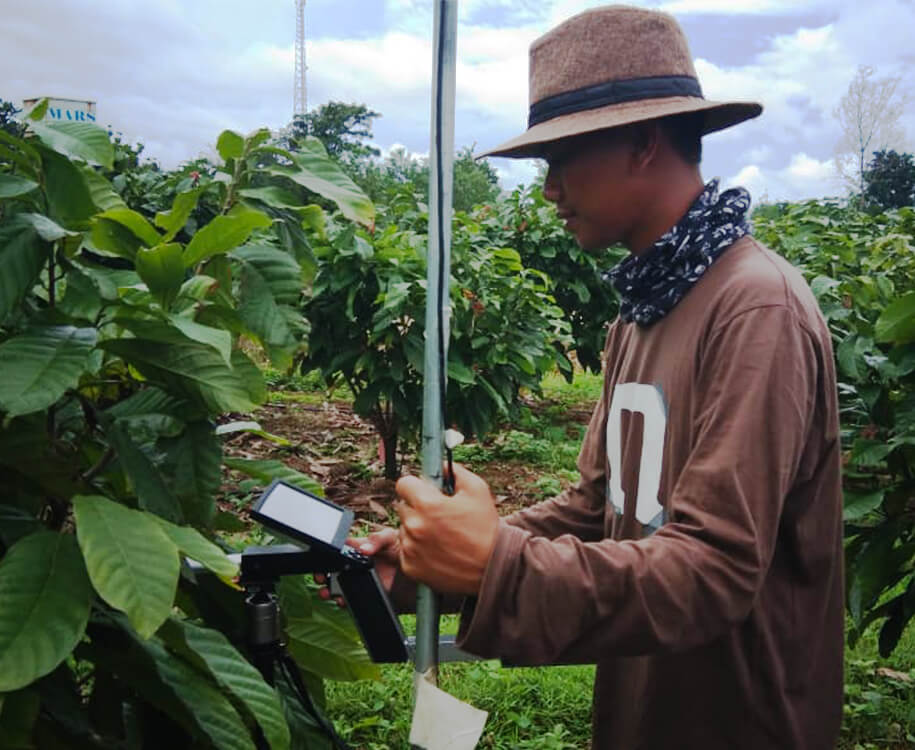

Seeing the Hidden Half: How CI‑600 Root Imaging Powers Ethiopia’s First Mulch‑SPAC Model
When drought takes hold in the Horn of Africa, the warning signs start below ground, out of sight and, until recently, out of reach. At Haramaya University’s Africa Center of Excellence for Climate‑Smart Agriculture & Biodiversity Conservation, PhD candidate and Assistant Professor Ephrem Mamo Weledekidane set out to change that. His goal: to watch roots…
How UMN Researchers Are Using Minirhizotron Technology to Advance Sustainable Agriculture
In the pursuit of more sustainable and resilient agricultural systems, understanding plant root systems is just as crucial as studying their above-ground growth. Researchers at the University of Minnesota’s Sustainable Cropping Systems Lab and the Intermediate Wheatgrass Breeding Lab are leveraging cutting-edge root imaging technology to better understand the underground dynamics of intermediate wheatgrass, also…
Exploring Cocoa Agroforestry: Enhancing Climate Resilience with CID Bio-Science Tools
Cocoa farming is a vital industry in West Africa, accounting for nearly 70% of the world’s cocoa production. Climate change poses significant challenges to this sector, making research into sustainable farming practices critical. Dr. Issaka Abdulai, a researcher at the University of Göttingen in Germany, has dedicated his career to understanding how cocoa agroforestry systems…
Exploring the Boreal Forest: How The Ridges Sanctuary Uses the CI-110 Plant Canopy Imager for Critical Ecological Research
In the heart of Door County, Wisconsin, The Ridges Sanctuary stands as a vital steward of one of the most biodiverse regions in the Midwest. This sanctuary, the first and oldest private land trust in Wisconsin, has been preserving its land since 1937. Under its care are 1,700 acres of boreal forest, a unique paleo…
The CI-710s Leaf Spectrometer: A Researcher’s Perspective
In a recent discussion with Scott Trimble, Vice President of Marketing for Felix Instruments, researchers Saroj Burlakoti and Anju Chaudhary from Utah State University shared their experiences using the CI-710s Leaf Spectrometer. The conversation highlighted the instrument’s critical role in their research, focusing on ornamental plants, water conservation, and fertilizer reduction. This article summarizes the…
Comparing the Usability Between CID Bio-Science’s CI-600 Root Imager and an Inexpensive Endoscope
In the evolving field of agriculture, our tools can significantly influence the outcomes of our research and farming practices. Recently, a comparative study was undertaken to analyze the usability of the CID Bio-Science’s CI-600 Root Imager against a more budget-friendly option, the Depstech ds450 endoscope. Here, we delve into the findings presented in a poster…
Challenges of Cold Stress in Rice: the Impact of Technology
A team of dedicated scientists led by Árpád Székely, Tímea Szalóki, Mihály Jancsó, János Pauk, and Csaba Lantos set out to understand the effects of cold stress on rice seedlings. The challenge was significant. Cold stress is a major factor affecting the growth and productivity of rice, a staple food for more than half of…
Teaching with plant science tools
Kim Collins and her team at Northport High School have been utilizing the CI-710s SpectraVue Leaf Spectrometer to lend a modern, data-driven approach to students’ research projects. In this interview, we dive into how this technology-forward curriculum is empowering the next generation of plant science researchers and explore two unique student-led projects using Spectravue.
Exploring root growth and development in HLB-affected citrus trees
Fifteen years of citrus greening disease (HLB) has had a devastating effect on Florida’s citrus industry, but the work of Dr. Lorenzo Rossi and his team is aiming to turn that around and making great strides using the CI-602 Narrow Gauge Root Imager.
![]()
Bringing new crops to light by looking below ground
The CI-600 In-Situ Root Imager allows Dr. Shinsuke Agehara and his team at University of Florida to develop a holistic understanding of established and emerging crops in Florida—from the ground, up.
![]()
Peering into plant pigmentation
Using the CI-710s SpectraVue Leaf Spectrometer, Dr. Catherine Simpson and her research team at Texas Tech University are gaining a deeper understanding of the nutritional and physiological qualities of various edible flowers and leafy vegetables over time.
![]()
Data-driven assessment of plant response
Using the CI-340 as an integral part of their robust testing platform, Stephanie Wedryk and her team at Rx Green Technologies are able to develop groundbreaking cultivations solutions for the commercial cannabis industry.
![]()
Modeling ecosystem functioning with precise plant data
In conjunction with LECA, PhyloAlps Project and Swiss Federal Research Institute, Amélie Saillard and her team use the CI-202 Portable Laser Leaf Area Meter to measure functional traits throughout the Alps, gathering vital information on each of the nearly 3500 alpine vegetal species.
![]()
Designing complex orchard systems with user-focused technology
As a Senior Agronomy Scientist at Mars inc., Rany Agustina Susanti and her team extensively used the CI-110 Plant Canopy Imager in their work to improve efficiency of high productivity cacao farms using orchard intensive cropping systems.
![]()
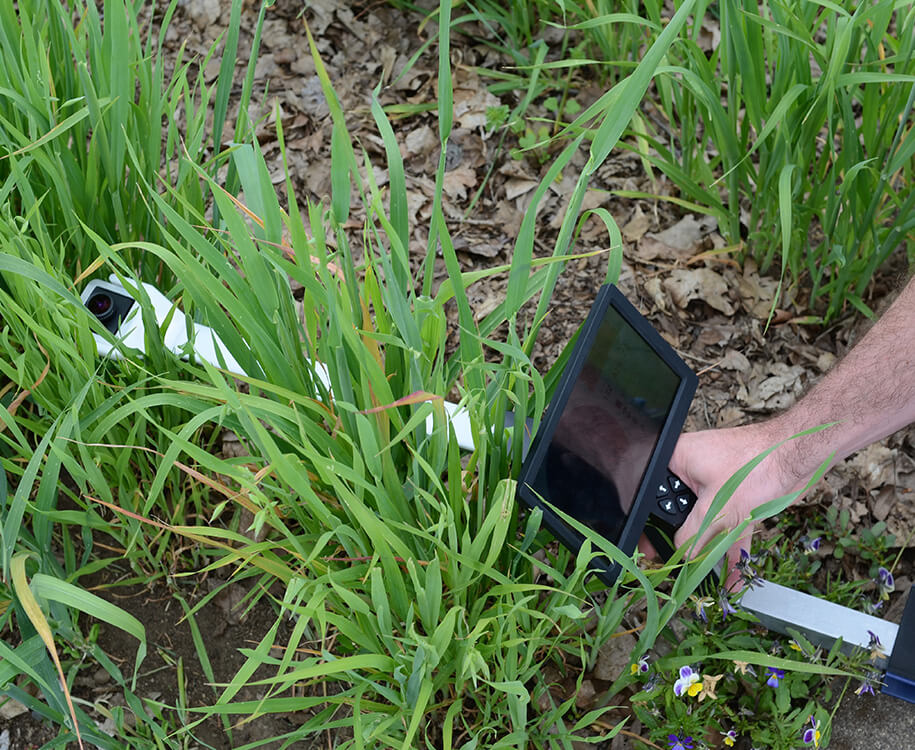
Work confidently, anytime, anywhere
The new Digital Plant Canopy Imager includes updated GPS accuracy with access to four different satellite constellations and the ability to interchange lens filters for even greater image accuracy.

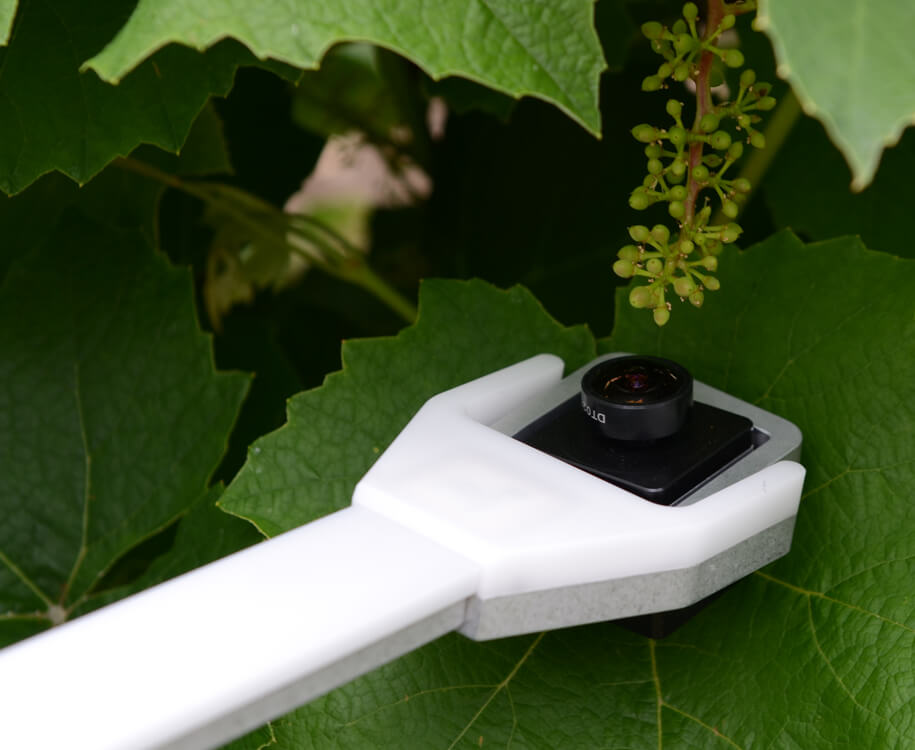
Self-leveling high-resolution camera
150° viewing angle with live-updating high-resolution fish-eye digital image acquisition. Digital color filters additionally allow the user to further distinguish between sky and plant.
PAR & Sunflecks measurement
Fully integrated ceptometer with 24 photodiodes to measure Sunflecks in the range of Photosynthetically Active Radiation.
Instant LAI analysis
On-board touchscreen for on-site analysis and evaluation of solar beam transmission coefficients or gap fractions for LAI analysis.
Easy location tracking
Internal compass and GPS ensure consistent, traceable measurements allowing for repeated measurements in the same location over the growing season.
Lightweight & portable
One-handed operation and durable, lightweight design allow for easy data capture in any location and field conditions.

More than 330+ published
research papers
using LAI & canopy analysis
Request a live demonstration
Retrieve plant canopy data instantly for analysis
Instantaneous, in-field calculation
Single measurement for comprehensive data collection and instantaneous, in-field calculation with integrated software.

Integrated touch screen
On-board touch screen allows for WYSIWYG application, rapid analysis, and evaluation of measurements.

Self-leveling high-resolution camera
150° viewing angle with live-updating high-resolution fish-eye digital image. No above-canopy reference measurement required.

LAI, PAR, sunflecks
On-site evaluation of solar beam transmission coefficients or gap fractions and ceptometer with 24 photodiodes to measure Sunflecks in the range of Photosynthetically Active Radiation.

Measurement of any crop in any conditions
Measurements can be taken of virtually any crop or forest – low lying plant canopies up to forest canopy in overcast or full sun environments.

Location mapping, digital masking & more
Internal compass and GPS, digital masking, color filters, and user-selected number of zenith and azimuthal divisions give the user complete control over measurements.
-
What improvements were made with the latest product redesign?
-
Providing users with accurate measurements in an easy-to-use form factor are our primary goals. To achieve this objective, the Plant Canopy Imager went through a complete overhaul in 2018. Major improvements included the addition of an on-board touchscreen for easy measurement visualization and the combination of all device parts into one, easily hand-held device.
-
Is the CI-110 waterproof?
-
The CI-110 is not designed to be waterproof and should not be used underwater. The CI-110 is designed to be water-resistant. Use in light rain is fine, however, there are electronics inside of the CI-110 that can be damaged from water entering the instrument, so it is not recommended to use the CI-110 during heavy rainfall. Furthermore, it should be noted that the tablet provided with the CI-110 is not waterproof and a waterproof case would need to be purchased for use in wet conditions.
-
What crops and broader foliage can I use the CI-110 to study?
-
The CI-110 has been used to effectively measure the leaf area index of forests, pastureland, grasslands, savanna, jungle and virtually any agricultural crop.
-
What different types of researchers use the CI-110?
-
Crop, forestry, environmental, plant, climate, hydrology, soil, and weed researchers all benefit enormously from the metrics that the Plant Canopy Imager provide.
Have additional questions?
Click the link below to speak with one of our staff scientists about your specific application.
Specifications
| Lens | Self-leveling hemispherical lens |
| Image Resolution | 8 megapixels |
| Interface | USB and Wifi |
| Measuring Time | < 1 second |
| Fish-eye Lens Angle | 150° |
| Operating Temperature | 5 to 50° C |
| Camera Sensor | 5 cm x 5 cm |
| Total Length | 84 cm |
| Imaging Probe and Arm Weight | 1.5 kg |
| PAR (Range / Accuracy) | 0-2500 umol m2s / 5 umol m2s |
Theory of Operation
Leaf Area Index (LAI) is defined as one sided leaf area divided by the total ground area. Photosynthetically Active Radiation (PAR) designates the spectral range of solar radiation (400-700 nm). By measuring PAR and LAI simultaneously, one is able to calculate LAI and canopy parameters using a variety of methodologies.

To calculate LAI, the CI-110 captures a 150° fisheye image of the canopy, which is divided into zenith and azimuthal divisions.
Using the software included on the tablet computer, the user can include or exclude any zenith and azimuth division to focus on specific portions of the canopy for study.
The most practical method for non-destructive LAI measurement is the Gap Fraction Method. Gap Fraction indicates how much of the sky is visible from beneath the plant canopy. The greater the area of sky that is visible, the larger the gap fraction.
When using the CI-110, a value between 0 and 1 is assigned to estimate the Gap Fraction in a canopy—0 means that no sky is visible below the plant canopy whereas 1 means that the entire area is sky is visible, or there is no foliage coverage. Any fraction indicates partial foliage cover.
Images taken with the CI-110 are divided into sectors according to the user-selected number of zenith and azimuthal division. The fraction of the sky (solar beam transmission coefficient) that is visible in each sector is automatically analyzed by tallying the sky portion of the image pixels in that sector. Once all sectors are analyzed and the average solar beam transmission coefficients for each zenith division are computed, the hemispherical diffuse radiation transmission coefficient (the sky view factor), mean foliage inclination angles, and plant canopy extinction coefficients are instantaneously computed by CI-110’s analysis software.
*Norman J.M. and Campbell, G.S. (1989) Canopy Structure. In: Plant Physiological Ecology, Field methods and instrumentation. (eds. R. W. Pearcy, . Ehleringer, H.A. Moorney and P.W. Rundel), Chapman & Hall, London and New York, pp. 301-325.
Get to know the CI-110 Plant Canopy Imager
Canopy Analysis in Agriculture: Outdoor and Greenhouse Applications
Plant Canopy Imager Live Training | CID Bio-Science
Canopy Imaging & Analysis Webinar: Made in the Shade - How 11 Research Studies Use Canopy Analysis
Cacao Undercover: Optimizing Cacao Orchard Systems using the CI-110 Plant Canopy Imager
CI 110 Plant Canopy Imager Live Demon Thursday, July 5, 2018 7 03 43 PM
In-depth canopy analysis any time, anywhere.
The new CI-110 combines hemispherical canopy photography and image analysis with light measurement to non destructively calculate leaf area index (LAI) and other canopy parameters.