The Importance of Leaf Area Index (LAI) in Environmental and Crop Research
Scott Trimble
October 14, 2020 at 1:03 am | Updated September 20, 2022 at 10:42 pm | 6 min read
Leaf Area Index (LAI), which is used as a measure in hundreds of studies on forests, crops, climate and the environment, is calculated as half the area of all leaves per unit area of ground. It is measured as the leaf area (m2 ) per ground area (m–2) and is unit-less. So, a plant with a LAI of 2 has an amount of leaves that can cover a given area two times. LAI is calculated for a plant or can be scaled up to give readings for a whole crop or even a region. It is one of the most important parameters to measure leaves and their activity.
Why is LAI important?
The significance of the LAI comes from the importance of leaves to the plants, which are many and varied.
Leaves are the major eco-physiological parts of a plant that interact with the atmosphere,
Subscribe to receive our monthly round-up of articles.
- Absorbing and assimilating carbon dioxide,
- Intercepting light necessary for photosynthesis,
- Releasing oxygen that is formed as a byproduct of photosynthesis,
- Being the site of water vapor loss during evapotransipiration, which helps to build pressure to absorb water from the ground,
- Intercepting rainfall and channelling water to branches and stems, and gradually to the roots,
- Taking the impact of the wind.
Leaves are an important source of carbohydrates produced during photosynthesis, which are converted to a myriad of chemicals that the plant needs.
- Nearly 90% of the biomass (or dry matter) of a plant is produced by leaves.
- These photosynthates drive the growth and yield of a plant.
The Leaf Area Index is thus an important indicator of radiation and precipitation interception, energy conversion, and water balance. Ultimately, it is a reliable parameter for plant growth. This is the reason why most studies in agronomy and horticulture measure the results of interventions such as fertilizers and irrigation in terms of LAI, as well as yield.
Optimum LAI
The levels of LAI will vary with the canopy architecture, which depends on the cultivars, geography, and field cultural practices. Then there are differences which arise from the types of crops and fruits. More is known about the optimum LAI for cereals than fruits. LAI for:
- Apples can be between 1.5 and 5.
- Peaches can be 7 to 10.
- Mangoes is, on average, 2.94 and can lie between 1.18 and 4.48.
- Oranges is high, between 9 and 11.
The Relationship Between LAI and Crop Yield
Since leaves are essential for photosynthesis and produce the bulk of biomass, the number of leaves (and LAI) will also influence yield. Moreover, most crop simulation models will use LAI to predict yield, given its importance in estimating the effect of environmental factors on plants.
The relationship between LAI leaves and yield is, however, not simple, and will vary with kinds of crops and at different life-stages of a plant. Therefore, LAI could be measured in different phases of the plant cycle to accurately calculate the optimum yield. Comparisons of LAI between different years is a good way to judge how well the crops are doing.
- Leaf as Yield: In the case of crops where the leafy parts are desirable, as in lettuce and spinach, maximising LAI is of direct benefit. When the fruits of plants are the yield, LAI’s influence can vary.
- Fruits: When the tree is younger, increasing LAI will boost fruit yield. However, if the canopy gets too thick and prevents light penetration to lower levels and to developing fruits, both yield quantity and quality will decrease in older fruit trees, as seen in oranges.
- Vegetables: In many vegetables, higher photosynthesis is linked to higher yield. Therefore, a higher LAI is needed. In vegetables such as tomatoes, decreasing LAI can impact biomass accumulation and yield. However, it is important to maintain only the optimum LAI, as increasing LAI beyond a certain point will not increase yield. Depending on the variety, an LAI of 3 to 4 is good for tomatoes.
- Cereals: In cereals, LAI determines biomass accumulation. However, an optimum LAI is sometimes a better goal depending on the variety of cereal, as increasing LAI may not increase photosynthesis due to shading, but does contribute to increased respiration. In rice, increasing LAI and photosynthesis are the goals, but in sorghum, the relationship between LAI and yield is high but negative. That is as LAI increases, yield will decrease.
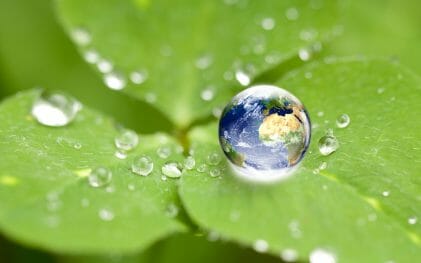
LAI is Relevant Due to Climate Change
The trade-off between leaf growth and fruit production has assumed added relevance due to climate change. Due to the increasing levels of carbon dioxide (CO2), many cultivars are devoting too much of their resources to making leaves rather than seeds. In soybeans, the fourth most cultivated seed crop, there has been a decrease of 8% to 10% in yield due to recent conditions of elevated CO2.
Measuring LAI
LAI can be measured directly or indirectly. In direct methods, the leaves are used as the basis of measurement.
Direct Methods
This method of LAI estimation is time-consuming and difficult, as it involves collecting leaves and measuring leaf area. The leaves can be collected:
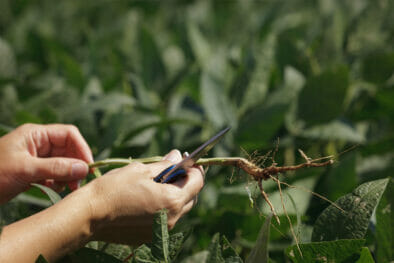
- Destructively by harvesting.
- Non-destructively by collecting leaf litter in traps on the ground.
The leaf area is estimated by three means:
1. Leaf measurement: In this method, each leaf area is manually measured. This is inefficient and expensive.
2. Planimetric method: Leaf perimeter is measured by a planimeter, the area of leaves is derived, and their ratio to the ground is calculated.
3. Gravimetric method: This method uses the relationship between biomass and the leaf area to calculate the LAI. Biomass is estimated by finding the dry weight of leaves.
Indirect Methods
Indirect LAI calculation can be non-contact, fast, and automated, and is, therefore, gaining popularity.
1. Inclined point quadrat: The vegetation canopy is measured by counting the number of contacts made by a needle in a given quadrat. This is time-consuming and suitable only for crops up to 1.5 meters high.
2. Digital plant canopy anaysis: Perhaps the most accurate analysis of leaf area index uses photography from either below or above the canopy to measure LAI. The hand-held CI-110 Plant Canopy Analyzer uses a hemispherical lens to take photos from beneath the canopy and automatically makes calculations for the user to measure LAI and Photosynthetically Active Radiation (PAR) levels.
LAI for Precision Agriculture
Besides its uses in measuring crop growth and as an indicator of yield, LAI is finding new applications in precision agriculture. LAI can be useful in calculating the correct amounts of foliar sprays of pesticides or fungicides that are needed to protect a crop. LAI can also diagnose the nitrogen status of cereals through satellite imagery leading to timely applications of fertilizers to boost yield. Given its importance, it is not surprising that new methods of estimating LAI are growing, coupled with novel purposes to monitor crops.
—
—
Vijayalaxmi Kinhal
Science Writer, CID Bio-Science
Ph.D. Ecology and Environmental Science, B.Sc Agriculture
Sources
Addai, I.K., and Alimiyawo, M. (2015). Graphical determination of leaf area index and its relationship with growth and yield parameters of sorghum (Sorghum bicolor L. Moench) as affected by fertilizer application. Journal of Agronomy, 14 (4), 272-278. 10.3923/ja.2015.272.278
Dammer, K. H., Wollny, J., and Giebel, A. (2008). Estimation of the leaf area index in cereal crops for variable rate fungicide spraying. European Journal of Agronomy, 28 (3), 351-360. https://doi.org/10.1016/j.eja.2007.11.001
Heuvelink, E., Bakker,M.J., Elings,A., Kaarsemaker,R.C., and Marcelis, L.F.M. (2005). Effect of leaf area on tomato yield. Acta Horticulturae 691. 691. https://doi.org/10.17660/ActaHortic.2005.691.2
Liu, X., Cao, Q., Yuan, Z., Liu, X., Wang, X., Tian, Y., Cao, W., and Zhu, Y. (2018) Leaf area index based nitrogen diagnosis in irrigated lowland rice. Journal of Integrative Agriculture
17(1) 111-121. https://doi.org/10.1016/S2095-3119(17)61714-3
Monteith, J. L., Moss C.J., Cooke, G. W., Pirie, N. W., and Bell, G. D. H. (1977). Climate and the efficiency of crop production in Britain. Philosophical Transactions of the Royal Society of London, Series B 281, 277–294. https://doi.org/10.1098/rstb.1977.0140
Patil, P., Biradar,P., Bhagawathi, A.U., and Hejjegar, I.S. (2018). A review on leaf area index of horticulture crops and its importance. Int.J.Curr.Microbiol.App.Sci. 7(4), 505-513. https://doi.org/10.20546/ijcmas.2018.704.059
Rauscher, F. (2018, April 3). I’ve Got You Covered: Leaf Area Index. Retrieved from https://www.maximumyield.com/ive-got-you-covered-leaf-area-index/2/3866
Sheehy, J.E., Mitchell, P.L., and Hardy B., editors. (2000). Redesigning rice photosynthesis to increase yield. Proceedings of the Workshop on The Quest to Reduce Hunger: Redesigning Rice Photosynthesis, 30 Nov.-3 Dec. 1999, Los Baños. Philippines. Makati City (Philippines): International Rice Research Institute and Amsterdam (The Netherlands): Elsevier Science B.V. 293 p.
Srinivasan, V., Kumar, P., and Long, S.P. (2017). Decreasing, not increasing, leaf area will raise crop yields under global atmospheric change. Global Change Biol. 23 (4), 1626–1635. https://doi.org/10.1111/gcb.13526
Tsialtas, J.T, and Maslaris, N. (2008). Evaluation of a leaf area prediction model proposed for sunflower. Photosynthetica, 46 (2), 294-297. https://doi.org/10.1007/s11099-008-0052-6
Xiao, S. van der Ploeg, A., Bakker, M., and Heuvelink, E. (2004). Two instead of three leaves between tomato trusses: Measured and simulated effects on partitioning and yield. Acta Hort. 654. Retrieved from https://core.ac.uk/download/pdf/29287997.pdf
Photo courtesy of Jomesh P A.
Related Products
Most Popular Articles
- Transpiration in Plants: Its Importance and Applications
- Leaf Area – How & Why Measuring Leaf Area…
- How to Analyze Photosynthesis in Plants: Methods and Tools
- Plant Respiration: Its Importance and Applications
- The Forest Canopy: Structure, Roles & Measurement
- Stomatal Conductance: Functions, Measurement, and…
- Forest & Plant Canopy Analysis – Tools…
- Root Respiration: Importance and Applications
- 50 Best Universities for Plant Science
- The Importance of Leaf Area Index (LAI) in…