Discover modern leaf spectroscopy
The SpectraVue Leaf Spectrometer measures transmission, absorption, and reflection, along with many other plant stress and pigment indicators using built-in indices.
Crop Optimization
CI-710s SpectraVue Leaf SpectrometerForest Productivity & Sustainability
Leaf spectral data in response to stressors can drive a wide variety of insights into forest health and management practices.Environmental research
Use spectral analysis to conduct non-destructive assays of physiological responses to different environmental conditions.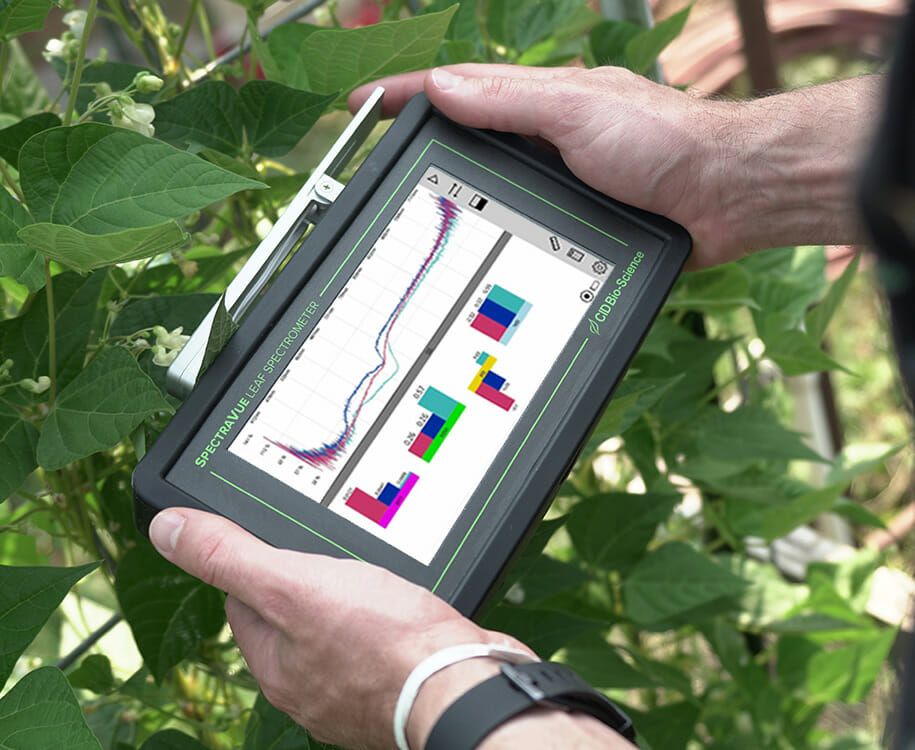

Seeing the Hidden Half: How CI‑600 Root Imaging Powers Ethiopia’s First Mulch‑SPAC Model
When drought takes hold in the Horn of Africa, the warning signs start below ground, out of sight and, until recently, out of reach. At Haramaya University’s Africa Center of Excellence for Climate‑Smart Agriculture & Biodiversity Conservation, PhD candidate and Assistant Professor Ephrem Mamo Weledekidane set out to change that. His goal: to watch roots…
How UMN Researchers Are Using Minirhizotron Technology to Advance Sustainable Agriculture
In the pursuit of more sustainable and resilient agricultural systems, understanding plant root systems is just as crucial as studying their above-ground growth. Researchers at the University of Minnesota’s Sustainable Cropping Systems Lab and the Intermediate Wheatgrass Breeding Lab are leveraging cutting-edge root imaging technology to better understand the underground dynamics of intermediate wheatgrass, also…
Exploring Cocoa Agroforestry: Enhancing Climate Resilience with CID Bio-Science Tools
Cocoa farming is a vital industry in West Africa, accounting for nearly 70% of the world’s cocoa production. Climate change poses significant challenges to this sector, making research into sustainable farming practices critical. Dr. Issaka Abdulai, a researcher at the University of Göttingen in Germany, has dedicated his career to understanding how cocoa agroforestry systems…
Exploring the Boreal Forest: How The Ridges Sanctuary Uses the CI-110 Plant Canopy Imager for Critical Ecological Research
In the heart of Door County, Wisconsin, The Ridges Sanctuary stands as a vital steward of one of the most biodiverse regions in the Midwest. This sanctuary, the first and oldest private land trust in Wisconsin, has been preserving its land since 1937. Under its care are 1,700 acres of boreal forest, a unique paleo…
The CI-710s Leaf Spectrometer: A Researcher’s Perspective
In a recent discussion with Scott Trimble, Vice President of Marketing for Felix Instruments, researchers Saroj Burlakoti and Anju Chaudhary from Utah State University shared their experiences using the CI-710s Leaf Spectrometer. The conversation highlighted the instrument’s critical role in their research, focusing on ornamental plants, water conservation, and fertilizer reduction. This article summarizes the…
Comparing the Usability Between CID Bio-Science’s CI-600 Root Imager and an Inexpensive Endoscope
In the evolving field of agriculture, our tools can significantly influence the outcomes of our research and farming practices. Recently, a comparative study was undertaken to analyze the usability of the CID Bio-Science’s CI-600 Root Imager against a more budget-friendly option, the Depstech ds450 endoscope. Here, we delve into the findings presented in a poster…
Challenges of Cold Stress in Rice: the Impact of Technology
A team of dedicated scientists led by Árpád Székely, Tímea Szalóki, Mihály Jancsó, János Pauk, and Csaba Lantos set out to understand the effects of cold stress on rice seedlings. The challenge was significant. Cold stress is a major factor affecting the growth and productivity of rice, a staple food for more than half of…
Teaching with plant science tools
Kim Collins and her team at Northport High School have been utilizing the CI-710s SpectraVue Leaf Spectrometer to lend a modern, data-driven approach to students’ research projects. In this interview, we dive into how this technology-forward curriculum is empowering the next generation of plant science researchers and explore two unique student-led projects using Spectravue.
Exploring root growth and development in HLB-affected citrus trees
Fifteen years of citrus greening disease (HLB) has had a devastating effect on Florida’s citrus industry, but the work of Dr. Lorenzo Rossi and his team is aiming to turn that around and making great strides using the CI-602 Narrow Gauge Root Imager.
![]()
Bringing new crops to light by looking below ground
The CI-600 In-Situ Root Imager allows Dr. Shinsuke Agehara and his team at University of Florida to develop a holistic understanding of established and emerging crops in Florida—from the ground, up.
![]()
Peering into plant pigmentation
Using the CI-710s SpectraVue Leaf Spectrometer, Dr. Catherine Simpson and her research team at Texas Tech University are gaining a deeper understanding of the nutritional and physiological qualities of various edible flowers and leafy vegetables over time.
![]()
Data-driven assessment of plant response
Using the CI-340 as an integral part of their robust testing platform, Stephanie Wedryk and her team at Rx Green Technologies are able to develop groundbreaking cultivations solutions for the commercial cannabis industry.
![]()
Modeling ecosystem functioning with precise plant data
In conjunction with LECA, PhyloAlps Project and Swiss Federal Research Institute, Amélie Saillard and her team use the CI-202 Portable Laser Leaf Area Meter to measure functional traits throughout the Alps, gathering vital information on each of the nearly 3500 alpine vegetal species.
![]()
Designing complex orchard systems with user-focused technology
As a Senior Agronomy Scientist at Mars inc., Rany Agustina Susanti and her team extensively used the CI-110 Plant Canopy Imager in their work to improve efficiency of high productivity cacao farms using orchard intensive cropping systems.
![]()
Established technology with new and powerful features
The newly redesigned SpectraVue Leaf Spectrometer has been upgraded with a powerful new spectrometer, handheld form factor, touchscreen display, and analysis software.

Powerful Spectrometer
The SpectraVue Leaf Spectrometer has been upgraded with a powerful new 360-1100 nm spectrometer, giving you cutting-edge analytical range.
7” touchscreen display
Fully integrated, full color, 7” IPS touchscreen display allowing for easy on-board data management & analysis.
Full suite of analysis software
A full suite of on-board spectral analysis software and 40+ built-in indices allow for real-time remote insight into your data.
GPS enabled
Integrated GPS tagging ensures consistent, traceable measurements in the field.
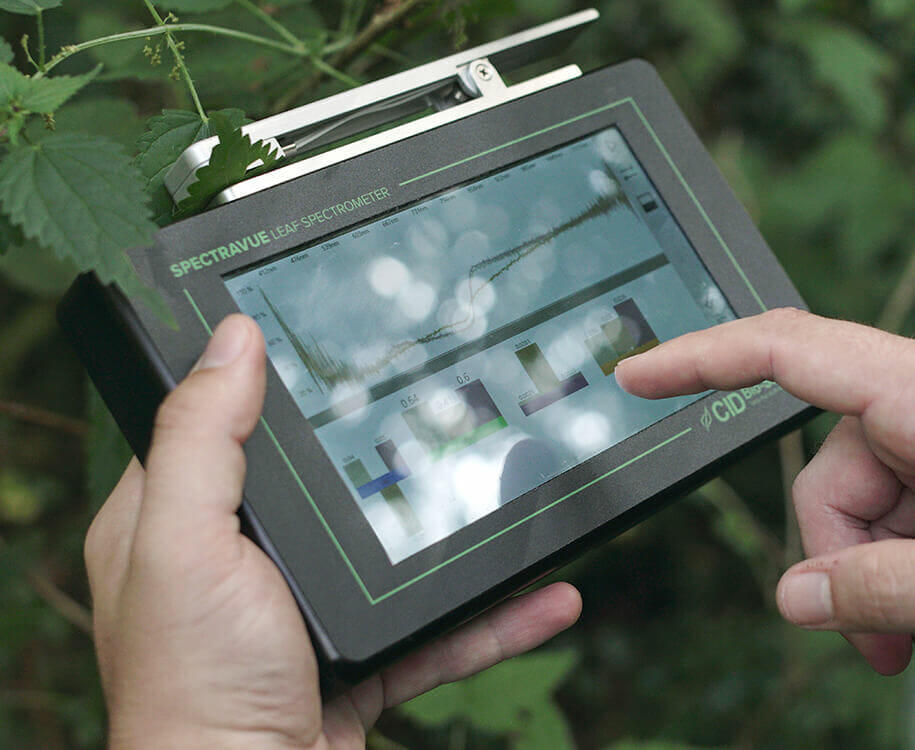
Lightweight & Portable
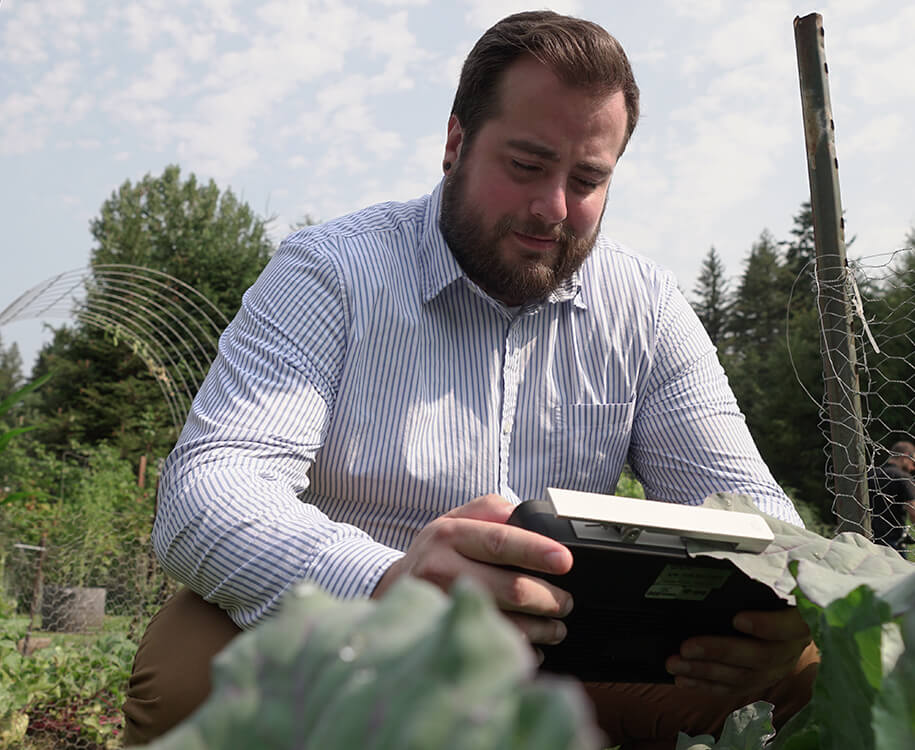
One-handed operation and durable, lightweight design allow for easy data capture in any location and field conditions.

More than 150+ published
research papers
using spectroscopic monitoring
in plants
Request a live demonstration
Powerful, handheld leaf spectroscopy

360-1100nm spectrometer
Equipped with a powerful new spectrometer, SpectraVue provides the cutting- edge analytical range needed by professionals in the field.

Fully integrated touchscreen display
Easily perform on-board data management & analysis with the full color, 7” IPS touchscreen display.

On-board analysis software
Get real-time insight into your data with SpectraVue’s full suite of spectral analysis software & 40+ built-in indices
Location tracking
Track measurement locations using built-in GPS tagging for consistent, traceable data collection over time.

One-handed operation
SpectraVue’s ergonomic design allows for easy capture of leaf spectral data in any location.
Absorbance, transmittance & reflectance
Collect varied spectral data instantly by measuring absorbance, transmittance & reflectance, all in a single scan.


-
Is the CI-710s waterproof?
-
The CI-710s is not designed to be waterproof and should not be used underwater. The CI-710s is designed to be water-resistant. Use in light rain is fine, however, there are electronics that can be damaged from water entering the instrument, so it is not recommended to use the CI- 710s during heavy rainfall.
-
Does this product come with a warranty?
-
All CID Instruments come with a 12-month warranty at the point of sale. The warranty covers repairing and replacing defective parts of the instrument that were manufactured directly by CID Bioscience. The warranty does not cover wear and tear, neglect, misuse, accident, or excessive deterioration. Further, unauthorized repair and alteration by an unauthorized party voids the warranty. More information can be found in the operation manual of your instrument.
-
What are the operating conditions for this product?
-
The operating conditions for the CI-710s are –10° to 50° Celsius and 0%-90% noncondensing humidity.
-
What different types of researchers use the CI-710s?
-
Plant physiology, forestry, environmental, and crop researchers all benefit enormously from the metrics that SpectraVue Leaf Spectrometer provides.
-
How much does the SpectraVue weigh?
-
The SpectraVue Leaf Spectrometer weighs 952 g.
Have additional questions?
Click the link below to speak with one of our staff scientists about your specific application.
Specifications
| Dimension | 220 mm x 150 mm x 30 mm |
| Weight | 952 g |
| Operating Environment | -30° to 70° C storage, -10° to 50° C Operation, 0% – 90% noncondensing humidity |
| Minimum Leaf Size | 10 mm x 10 mm |
| Display | 7” 1024 x 600 IPS Display |
| Languages | English, Spanish |
| Measure modes | Reflectance, Transmittance and Absorbance |
Detector Specifications
| Detector | CMOS Linear Array |
| Wavelength Range | 360 – 1100 nm |
| Pixels | 2048 pixels |
| Pixel Size | 14 μm x 200 μm |
| Pixel Well Depth | 100,000 electrons |
| Signal-To-Noise Ratio | 330:1 (at full signal) |
| A/D Resolution | 16 bit |
| Dark Noise | 16 counts |
| Corrected Linearity | >99.8% |
| Sensitivity | 337.500 |
| Wavelength Data Increment | 0.55 – 0.7 nm |
Spectroscopic
| Grating | 300 lines/mm, Slit = 55 μm |
| Optical Resolution | 2.4 FWHM in nm |
| Integration Time | 30 μs – 60 seconds |
| Dynamic Range | 3300:1 |
| Stray Light | 0.2 – 1.0% |
Electronics
| Power Supply | Two 18650 batteries and USB-C |
| Battery life | 3 – 4 hours |
| Trigger Modes | Manual |
Built-in Indices
| Abbrev | Index |
| ARI1 | Anthocyanin Reflectance Index 1 |
| ARI2 | Anthocyanin Reflectance Index 2 |
| BI | Boron Index |
| CaI | Calcium Index |
| CCI | Chlorophyll Content Index |
| CI green | Green Chlorophyll Index |
| CI red | Red-Edge Chlorophyll Index |
| CI Red Edge | Red-Edge Chlorophyll Index (version 2) |
| CRI1 | Carotenoid Reflectance Index 1 |
| CRI2 | Carotenoid Reflectance Index 2 |
| Ctr1 | Carter Index 1 |
| Ctr2 | Carter Index 2 |
| CuI | Copper Index |
| DCNI | Double-Peak Canopy Nitrogen Index |
| FRI | Flavonols Reflectance Index |
| G | Greenness Index |
| GM1 | Gitelson and Merzlyak Index 1 |
| GM2 | Gitelson and Merzlyak Index 2 |
| GNDVI | Green Normalized Difference Vegetation Index |
| GRVI | Green Ratio Vegetation Index |
| KI | Potassium Index |
| LCI | Leaf Chlorophyll Index |
| Lic1 | Lichtenthaler Index 1 |
| Lic2 | Lichtenthaler Index 2 |
| MCARI | Modified Chlorophyll Absorption Ratio Index |
| MCARI1 | Modified Chlorophyll Absorption Ratio Index 1 |
| MCARI2 | Modified Triangular Vegetation Index 2 |
| MnI | Manganese Index |
| MRESRI | Modified Red Edge Simple Ratio Index |
| Abbrev | Index |
| MTCI | MERIS Terristrial Chlorophyll Index |
| NDCI | Normalized Difference Chlorophyll Index |
| NDRE | Normalized Difference Red-Edge |
| NDSI | Normalized Difference Spectral Index |
| NDVI | Normalized Difference Vegetation Index |
| NI | Nitrogen Index |
| NPCI | Normalized Pigment Chlorphyll Index |
| NPCI642 | Normalized Pigment Chlorphyll Index (version 2) |
| NPQI | Normalized Phaeophytization Index |
| NRI | Nitrogen Reflectance Index |
| OSAVI | Optimized Soil-Adjusted Vegetation Index |
| PI | Phosphorous Index |
| PPR | Plant Pigment Ratio |
| PPR | Plant Pigment Ratio (version 2) |
| PRI | Photochemical Reflectance Index |
| PRI | Photochemical Reflectance Index (version 2) |
| PSNDa | Pigment Specific Normalized Difference |
| PSRI | Plant Senescence Reflectance Index |
| RENDVI | Red Edge Normalized Difference Vegetation Index |
| REP LI780 | Red Edge Position: Linear Interpolation Method |
| RVI800 | Ratio Vegetation Index |
| SI | Sulfur Index |
| SIPI | Structure Intensive Pigment Index |
| SPAD | Soil-Plant Analysis Development |
| SRPI | Simple Ratio Pigment Index |
| TCARI | Transformed Chlorophyll Absorption in Reflectance Index |
| TVI | Triangular Vegetation Index |
| VOG1 | Vogelmann Red Edge Index 1 |
| VOG2 | Vogelmann Red Edge Index 2 |
| VOG3 | Vogelmann Red Edge Index 3 |
| WBI | Water Band Index |
| ZMI | Zarco-Tejada & Miller Index |
Theory of operation
SPECTRAVUE is a powerful spectrometer paired with a leaf probe attachment, on-board operating software, and display screen. Two broadband light sources are attached inside the device. One is positioned in the leaf clamp for transmissive measurements, and one is placed inside the case for reflective measurements. The spectrometer module takes the light from the leaf probe attachment and projects the wavelength dispersed light onto a CCD array. Each pixel of the CCD array thus corresponds to a specific wavelength of light. The operating software displays the light intensity of each pixel of the CCD array.
Three spectroscopic measurements can be performed by SPECTRAVUE:
Transmittance (T) is the fraction of the incident light passing through a sample, such as a leaf. When the intensity of the incident light is Io, and the intensity of light passing through the sample is It, the transmittance, T, is then expressed as T = It / Io. The CI-710s software suite can automatically calculate and plot the transmission spectrum with the reference spectrum (the intensity profile of the light source) stored.
Absorbance (A) is related to the transmittance as A = – log T = -log(It / Io). Absorbance is commonly denoted in optical density (OD) as it is linearly proportional to the amount of light absorbing sample in the light path length (Beer-Lambert law). For example, in a standard 1-cm cuvette, a sample with an OD of 2 is twice as concentrated as a sample with an OD of 1. But note that the intensity of light transmitted from a sample with an OD of 2 is only 1/10 of that from a sample with an OD of 1. Transmission and absorption spectrum measurements are the most common applications of spectrometers. The spectrum can be used for the quantification of chemical concentrations, color analysis, the study of photochemical reactions such as photosynthesis, and the quantification of physical or optical properties such as film thickness, index of refraction, and extinction coefficient.
Reflectivity (R) is the fraction of incident light that is reflected from a sample. Depending on the purposes of the study, reflectivity can be measured for reflection at a specific angle from the sample, or the entire reflected hemisphere. The leaf probe attachment of CI-710s is not designed to measure the directional reflectivity. Nonetheless, it can be used to measure the absorption spectrum of surface substance of reflective or opaque samples.
Get to know the CI-710s SpectraVue Leaf Spectrometer
Invisible Signals 2024: How To Use Plant Spectroscopy To Reveal Disease & Enhance Plant Health
How To Calibrate Your SpectraVue Leaf Spectrometer
SpectraVue Leaf Spectrometer Live Training | CID Bio-Science
SpectraVue Preview Webinar
Non-destructive, rapid measurement of plant stress & pigments
The newly redesigned SpectraVue Leaf Spectrometer has been upgraded with an all new spectrometer (360-1100 nm) to allow full operation in a handheld form factor with a 7” 1024 x 600 IPS touchscreen display.