Forest & Plant Canopy Analysis – Tools & Methods
Scott Trimble
October 14, 2020 at 12:55 am | Updated September 20, 2021 at 3:34 pm | 6 min read
Canopy Analysis for Crop, Forest & Plant Research
The range of applications of canopy cover analysis is truly astounding. Canopy analysis derives its usefulness from the vitality of the canopy. Many methods to measure canopy cover have been developed in the last 80 years to meet various objectives. Not surprisingly, there have been several comparisons of the tools in different parts of the world. A general knowledge of canopy cover and the various methods to measure it are necessary before choosing the right tool.
Why is Canopy Cover Important?
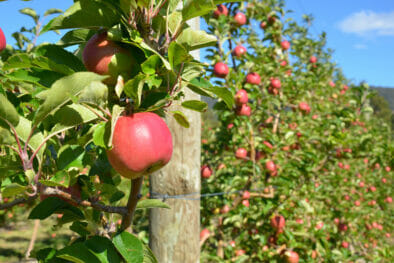
Canopy cover is the layer formed by the branches and crowns of plants or trees. The cover can be continuous, as in primary forests, or discontinuous – with gaps – as in orchards. Canopies in tropical and temperate forests can be important habitats for many animals and plants.
A dense canopy cover will let little light reach the ground and will lower temperatures. The canopy protects the ground from the force of rainfall and makes wind force more moderate. Thus, habitat conditions on the ground are shaped by the degree of canopy cover.
Subscribe to receive our monthly round-up of articles.
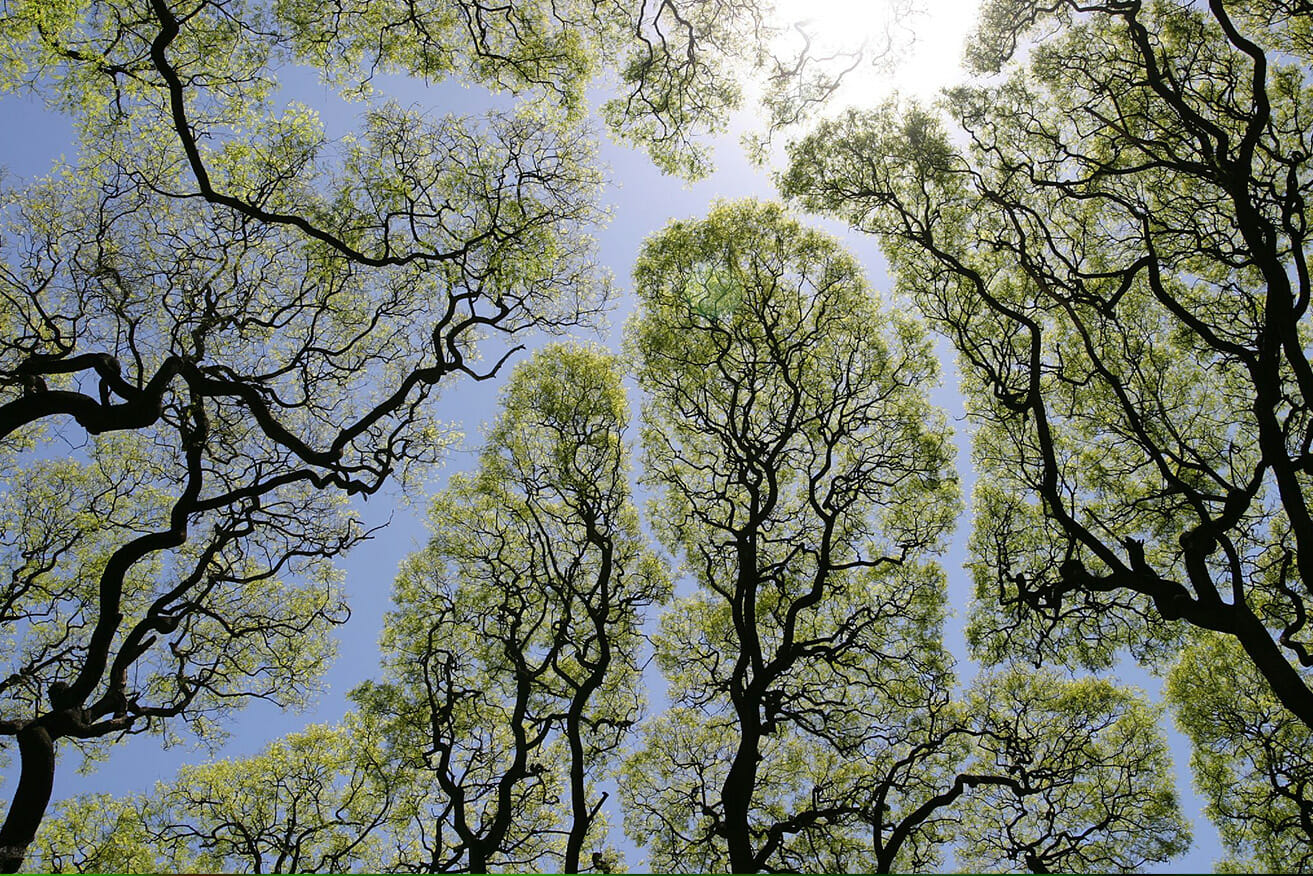
Forest canopies differ, and so do their effects on the surrounding ecology. It is easy to imagine how the canopy of a broadleaved forest differs from that of a coniferous forest or a rainforest.
The Importance of Canopy Cover Measurement
Canopy cover is measured as the proportion of a fixed area of the ground covered by tree crowns. The canopy cover will be determined by the tree species, as they have different crown sizes, shapes, and heights.
Tree canopy measurements are important for various reasons:
- The canopy can be affected by the health of a tree, which in turn is affected by nutrition, water access, disease, pest infestations, and stress. Thus, canopy cover acts as an indicator of these factors for both natural as well as cultivated groves and forests.
- The efficiency of fertilization, irrigation, and pruning methods in agriculture, horticulture, and floriculture also affect the canopy cover, so its measurement sheds light on these factors as well.
- In forests, canopy cover is also used to study the effects of fire, pollution hazards, and microclimate. The impact of forest use, in terms of deforestation, degradation, thinning or afforestation, can also be evaluated by canopy cover.
- The canopies of forests and other natural vegetation are important in watershed areas for replenishing groundwater and hydrology, so they need to be monitored.
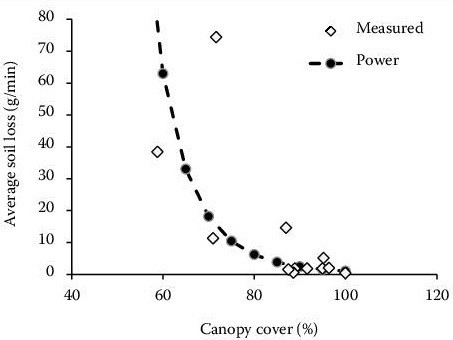
Figure 1. Soil loss decreases as canopy cover of oats and wheat increases in the Czech Republic (Image credits: Davidovál et al. 2015, DOI: 10.17221/903/2014-PSE).
To find out more about canopy cover, consult the following sources:
- Mongabay’s introduction in What is the Canopy
- FAO about effects of plant cover
- STRI about effects of canopy cover of tree plantations
Disciplines and Industries in Which Canopy Cover is Relevant
Canopy cover measurement is common in many natural sciences, as well as the food production industry. Some examples are:
- Silviculture
- Forest Inventory
- Forestry Management
- Horticulture
- Agriculture
- Agroforestry
- Hydrology
- Carbon Accounting
- Soil Erosion Control
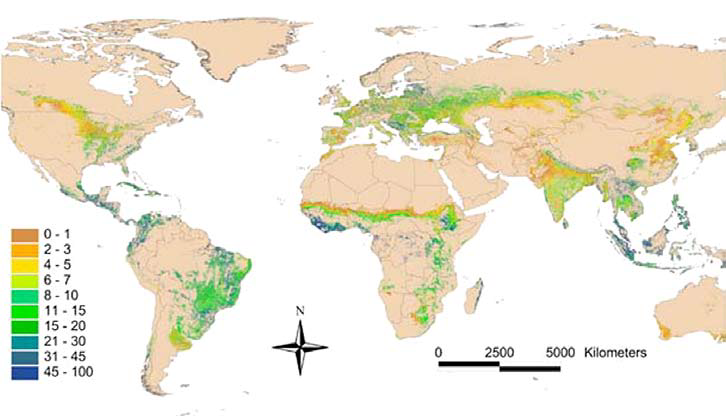
Figure 2: Map showing tree canopy cover on agricultural land at a global level. Forty-six percent of agricultural land globally has at least 10% tree cover. (Source: Zomer et al. 2009; Image credits: Minang et al. 2013)
Modern instruments are affordable, portable, and handheld, making measurements in the field easy. These are widely used on site by:
- Scientists studying forests, silviculture, food cultivation, hydrology, and soil erosion control;
- Foresters who measure canopy cover to track the growth and health of forests;
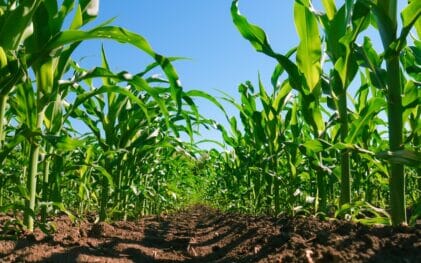
- Farmers and growers monitoring crops (some are more dependent on canopies as they use shade trees for their crops such as coffee, cardamom, etc.); and
- Those in charge of watershed management.
Measuring Canopy Cover
There are many methods to measure canopy cover, and, likewise, there are several commercial tools available on the market. Some of the more important ones are described below.
The convex spherical densiometer is a pocket-sized instrument that uses a convex mirror with a grid of 24 squares. Canopy cover is calculated from the number of squares on the mirror filled with vegetation.
The angular densiometer has a convex mirror, a compass, a bubble level, and a fixed eyesight. It produces a clearer image and a more exact estimation of canopy cover than the convex spherical densiometer.
The moosehorn uses 25 dots on a 5 x 5 grid on a transparent screen; the dots covered by canopy are counted through a side aperture to give an estimate of the vertical projection on the canopy.
The canopy-scope is an improvement on the moosehorn and uses the same principle of 25 dots on a 5 x 5 grid. This instrument is affordable, compact, and accurate. It has the advantage of being less prone to user error compared to other tools.
The vertical tube is a 20cm-long brass tube mounted in such a way that it hangs vertically. It is used to measure crown projection but requires many more points of observation within a given area compared to other methods.
Single-point and handheld light sensors estimate the light that comes through the canopy cover. They do, however, need a reference measurement under an open and clear sky. The disadvantage of this method is that it measures only light transmittance.
Hemispherical photography (HP) and digital analysis uses the fisheye lens approach and produces the most accurate measurements. It can be used for estimating canopy cover, light transmittance, leaf area index and photosynthetically active radiation. It is suitable for tree level measurements of crown architecture and dimensions, and density. These estimates are scalable, as they are related to stand level canopy cover.
In all the above methods, except HP, the resolution decreases with canopy cover over 30%.
Our in-house example of hemispherical photography measurement is the CI-110 Plant Canopy Imager which calculates leaf area index (LAI) and photosynthetically active radiation (PAR) levels. Using these two indices, the canopy cover is calculated.
The LAI is estimated by a 150 fisheye image of the canopy. The non-destructive method Gap Fraction Method measures the area of sky not visible due to canopy cover utilizing a classification system of 0-1. Here, 0 means the canopy cover has no gaps, while 1 means there is no canopy above, and the sky is fully visible.
Photosynthetically Active Radiation (PAR), which is the part of the visible light used by plants for photosynthesis, lies in the wavelength range of 400-700 nm. The CI-110 finds out the wavelength of the light filtering through the canopy.
The CI-110 is versatile, as it needs no above canopy reference measurements and is suitable for trees, shrubs and other low plants. A GPS connected to four satellites and an internal compass allow time series measurements at a single location.
The Best Time for Measurements
The best time and weather conditions for canopy cover estimation will depend on the objective of the study, as well as the instrument being used.
- Hemispherical photography should not be used midday or in bright sunshine. Cloudy skies give better results with HP.
- Single-point and handheld light sensors require a reference measurement of light transmittance under clear skies.
- Photosynthetic active radiation (PAR) is recorded at midday.
Advanced Canopy Cover Analysis
Rapid technological development has been going hand in hand with the growing applications of canopy cover estimation. Tools from CID Bioscience are convenient and user-friendly. They combine light transmittance and canopy cover data to give high accurate results suitable for many applications in several disciplines. The ability to store large amounts of data and transfer it easily to computers gives the CI-110 an advantage over other instruments used for canopy analysis.
—
—
Vijayalaxmi Kinhal
Science Writer, CID Bio-Science
Ph.D. Ecology and Environmental Science, B.Sc Agriculture
Sources
Calder, I., Hofer, T., Vermont S., and Warren, P. Towards a new understanding of forests and water. Retrieved from http://www.fao.org/3/a1598e/a1598e02.htm
Canopy. Retrieved from https://www.maximumyield.com/definition/899/canopy
Davidová, T & Dostál, Tomáš & David, Vaclav & Strauss, Peter. (2015). Determining the protective effect of agricultural crops on the soil erosion process using a field rainfall simulator. Plant Soil and Environment. 61. 109-115. 10.17221/903/2014-PSE.
Fact Sheet Canopy Cover. Retrieved from http://openknowledge.nau.edu/1273/7/Egan_2010_ERIFactSheet_CanopyCover%281%29.pdf
Lemmon PE (1957) A new instrument for measuring forest overstory density. J For 55:667–669.
https://doi.org/10.1093/forestscience/2.4.314
Mailly D. (2017) Hemispherical Photography in Support of Forest Inventory and Silviculture. In: Fournier R., Hall R. (eds) Hemispherical Photography in Forest Science: Theory, Methods, Applications. Managing Forest Ecosystems, vol 28. Springer, Dordrecht. https://doi.org/10.1007/978-94-024-1098-3_8
Martinez-Cob, A., Faci, J.M, Blanco, O., Medina, E.T., & Suvočarev K.(2014). Feasibility of using pyranometers for continuous estimation of ground cover fraction in table grape vineyards. Spanish Journal of Agricultural Research 12: 603-610, http://dx.doi.org/10.5424/sjar/2014123-5453
McIntosh, A. C.S., Gray, A. N., and Garman, S. L. (2012). Estimating canopy cover from standard forest inventory measurements in western Oregon. Forest Science, 58: 154-167.; http://dx.doi.org/10.5849/forsci.09-127
Minang, P. A, Bernard, F., Van Noordwijk, M., & Kahurani, E. (2013). Agroforestry in REDD+: Opportunities and Challenges. https://www.researchgate.net/publication/258926411_Agroforestry_in_REDD_Opportunities_and_Challenges
Moffett, M.W. (2000). What’s up? A critical look at the basic terms of canopy biology. Biotropica 32:569-596. https://bioone.org/journals/biotropica/volume-32/issue-4/0006-3606(2000)032%5b0569%3aWSUACL%5d2.0.CO%3b2/Whats-Up-A-Critical-Look-at-the-Basic-Terms-of/10.1646/0006-3606(2000)032[0569:WSUACL]2.0.CO;2.short
Why is canopy cover important? Retrieved from http://vitalsignsme.org/help/why-canopy-cover-important
Related Products
Most Popular Articles
- Transpiration in Plants: Its Importance and Applications
- Leaf Area – How & Why Measuring Leaf Area…
- How to Analyze Photosynthesis in Plants: Methods and Tools
- Plant Respiration: Its Importance and Applications
- The Forest Canopy: Structure, Roles & Measurement
- Stomatal Conductance: Functions, Measurement, and…
- Forest & Plant Canopy Analysis – Tools…
- Root Respiration: Importance and Applications
- 50 Best Universities for Plant Science
- The Importance of Leaf Area Index (LAI) in…