Spectral Imaging and Disease Detection in Eggplant
Scott Trimble
December 2, 2021 at 9:09 pm | Updated March 16, 2022 at 12:35 pm | 5 min read
Disease Detection in Eggplant
A group of crop scientists, Srivastava, Roy, Kimothi, Kumar, Sehgal, Mamatha, and Ray wanted to find the vegetative indices and hyperspectral bands with which people could monitor diseases in eggplant, also known as brinjal.
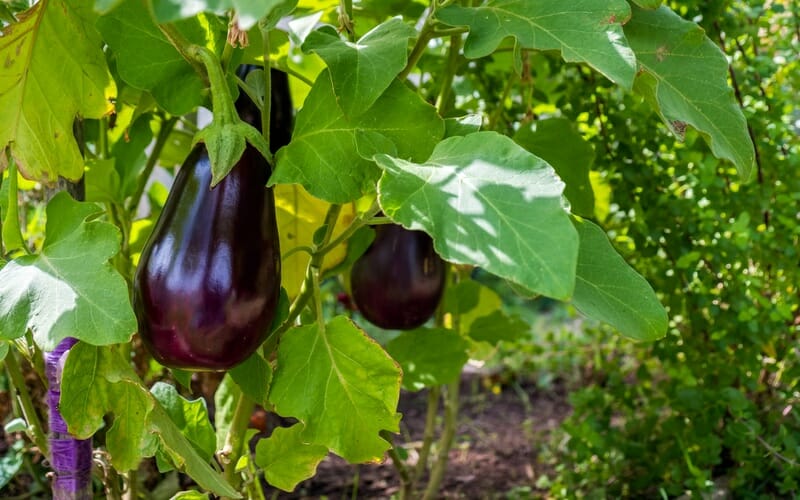
Eggplant (Solanum melongena) is the fourth most used fresh produce commodity in the world after potato, onion, and tomato. In India alone, around 1.4 million small farmers depend on this vegetable to get assured returns.
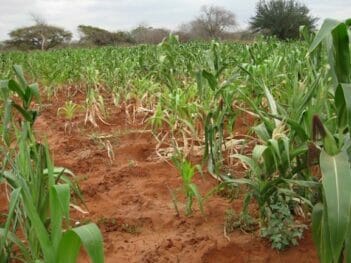
Bacterial wilt disease caused by Pseudomonas solancearum, which is widespread in tropics and sub-tropics, has been reported to have caused severe crop damage and loss in India, with summer crops being more prone to it. The pathogen enters the water vessels, where it grows and blocks them leading to yellowing and wilting of leaves and ultimate drying of the entire plant. Hence there has been a concerted effort to detect the disease early so that the affected plants can be treated before the infestation becomes severe, to avoid potential crop loss, and reduce chemical use in treatment through variable rate application.
Subscribe to receive our monthly round-up of articles.
Hyperspectral Imaging
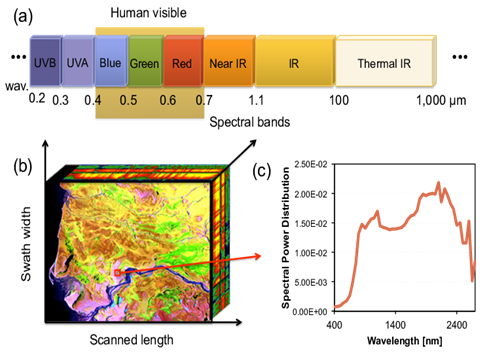
Spectral imaging uses two principles, getting two-dimensional spatial information from the images, and using spectroscopy to measure the color of the images.
The number of wavelengths and their mode of capture determine if the imagery is multispectral or hyperspectral. In multispectral imagery, the images are captured in 4 to 20 distinct bands of wavelengths (or stacks). While in hyperspectral images more than 20 wavelength bands are captured as a continuous spectrum, each has its own applications.
Hyperspectral imagery (HSI) is suitable for applications where small differences along continuous spectra are needed, for example in disease detection. Nowadays it is even possible to collect 3D hyperspectral imagery.
In precision farming solutions, spectral data with remotely sensed imagery is used to monitor plant growth, biomass, and stress.
Applying HSI for Disease Detection
The scientists leveraged the knowledge that stressed plants tend to absorb less red light and more near-infrared (NIR). This change in spectral behavior is used to detect disease stress in plants.
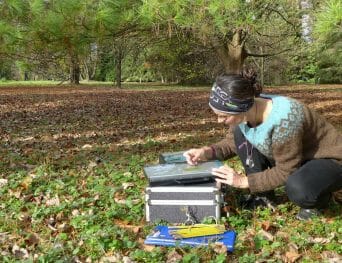
The scientists estimated this red edge shift by recording HSI using a handheld spectroradiometer. They made reflectance measurements one meter above the crop canopy with the sensor facing the crop, between 11:00 am and 1:00 pm. The spectral data were analyzed by the software View Spec Pro. The continuous reflectance spectra were obtained between the range of 325 to 1075 nm at 1 nm intervals, with the data preprocessed at a bandwidth of 10 nm.
Reflectance in the red band (600–700 nm) is sensitive to leaf chlorophyll content, and in the NIR (700–900 nm) to Leaf Area Index (LAI), so these biophysical parameters were also monitored by the scientists in their experiment.
They measured chlorophyll content using a chlorophyll meter. It measured the Chlorophyll Concentration Index (CCI) by using the transmittance ratio at 931 nm to 653 nm. A CCI estimate of around 1 indicates that that red and NIR radiation is equal, and there is little or no chlorophyll left in the leaves.
The scientists measured Leaf Area Index with the Plant Canopy Imager C-110, manufactured by CID Bio-Science Inc. The device uses a 150o fisheye lens to take canopy images that are used in the Gap Fraction Method to calculate LAI. A value of zero represents a dense canopy cover through which no ground is visible and a value of 10 that indicates bare ground.
Using the spectral data, the scientists calculated 21 vegetative indices, listed in Table 1. Based on the variation in different vegetative indices as infestation increases, it is possible to estimate disease intensity.
Scientists can also use instruments like the CI-710s Spectravue Leaf Spectrometer, which measures absorbance, reflectance, and transmittance of visible and NIR light to quantify chemical concentrations and for color analysis. Moreover, the tool has programmed software that can calculate forty vegetative indices including most of the ones used in this experiment.
Next, the scientists did a correlation analysis of the vegetative indices with the biophysical parameters of chlorophyll content and LAI of healthy and diseased plants.
Table 1: “Formulas used for computation of various hyperspectral vegetation indices,” Srivastava et al. 2019 (Credits: 10.5194/isprs-archives-XLII-3-W6-515-2019).

HSI Captures Differences in Healthy and Diseased Eggplant
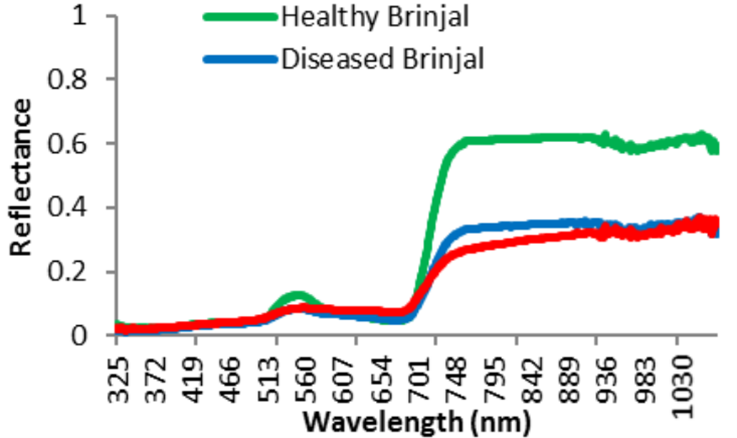
There was a clear difference in the spectra data that the scientists measured from healthy and diseased plants, as shown in Figure 2. In diseased eggplant, there is yellowing, due to a loss of chlorophyll, which usually absorbs red and blue wavelengths. Hence, when there is less pigment, plants will reflect more red and blue light than healthy plants, which reflect more green light. The diseased plants also reflect less NIR wavelengths, due to internal leaf damage of the mesophyll layer by the pathogen.
Important Vegetative Indices
The scientists were able to identify that single bands 800 nm and 920 nm and bandwidths of 528-531 nm, 550-570 nm, 710-760 nm were significantly correlated with LAI and CCI.
The other vegetative indices that were also correlated significantly with the two biophysical parameters measured were:
- Greeness Index
- Modified Chlorophyll Absorption in Reflectance Index
- Photochemical Reflectance Index
- Transformed Chlorophyll Absorption in Reflectance Index
- Simple Ratio Pigment Index
- Triangular Vegetation Index
- Structure Intensive Pigment Index
- Lichtenthaler Indices
The scientists were able to identify the optimal wavelengths and the vegetative indices that can be used to differentiate diseased eggplants from healthy ones.
These findings can be used on the ground with handheld imaging and also for remote imagery obtained by drones and satellites. Since bacterial wilt affects whole swathes of tropics and sub-tropics, the application of the research findings have international importance.
Advantages of Spectral Data
Spectral data analyzes internal changes not visible to the human eye. These changes begin well before external symptoms appear due to a disease infestation in plants. By using spectral information in disease monitoring, people can get an early warning of plant stress, and take proactive measures. Usually, this means that a smaller portion of the farm has to be treated.
Moreover, as disease intensity is lower when addressed in the early stages, the amount of treatment needed is also reduced. With this in mind, farmers can save money while improving crop health and productivity. The reduction in chemicals used decreases the risk that crops will develop pesticide resistance and is also better for the environment, making agriculture more sustainable.
—
Vijayalaxmi Kinhal
Science Writer, CID Bio-Science
Ph.D. Ecology and Environmental Science, B.Sc Agriculture
Sources
Kim, M. H. (2013). 3D Graphics Techniques for Capturing and Inspecting Hyperspectral Appearance. International Symposium on Ubiquitous Virtual Reality, 15-18, DOI: 10.1109/ISUVR.2013.15.
Srivastava, A., Roy, S., Kimothi, M. M., Kumar, P., Sehgal, S., Mamatha, S., & Ray, S. S. (2019). Detection of Bacterial Wilt Disease (pseudomonas Solancearum) in
Brinjal Using Hyperspectral Remote Sensing. ISPRS International Archives of the Photogrammetry, Remote Sensing and Spatial Information Sciences, XLII-3/W6, 515-520. 10.5194/isprs-archives-XLII-3-W6-515-2019
Related Products
Most Popular Articles
- Transpiration in Plants: Its Importance and Applications
- Leaf Area – How & Why Measuring Leaf Area…
- How to Analyze Photosynthesis in Plants: Methods and Tools
- Plant Respiration: Its Importance and Applications
- The Forest Canopy: Structure, Roles & Measurement
- Stomatal Conductance: Functions, Measurement, and…
- Forest & Plant Canopy Analysis – Tools…
- Root Respiration: Importance and Applications
- 50 Best Universities for Plant Science
- The Importance of Leaf Area Index (LAI) in…