What Is Leaf Area Index and Why Is It Essential for Plant and Climate Research?

Dr. Vijayalaxmi Kinhal
December 23, 2025 at 5:04 pm | Updated December 23, 2025 at 5:04 pm | 11 min read
- Leaf area index (LAI) is one of the most widely used measurements for describing plant canopy structure and interactions with the environment in plant research.
- LAI is widely used in research because it can upscale crucial leaf physiological processes and is easy to compare across scales and ecosystems.
- It can be estimated from remote-sensed data to understand stand-to-large-scale processes and has applications in agriculture, forest research, and management.
- LAI is a key variable to understand carbon fluxes and their effects in climate change models.
Leaf Area Index is a key parameter used to study plant physiology, vegetation canopy geometry, and biogeochemical cycles and ecological processes at scales ranging from local to regional and global. It’s a dimensionless quantity used to scale leaf-level plant processes to large scales. It can therefore be used to collect field data and scale it up to understand large-scale ecosystem dynamics.
What is Leaf Area Index (LAI)?
Leaf Area Index (LAI) is the one-sided area of all leaves per unit area of ground. It is measured as the leaf area (m2) per ground area (m–2) and is unitless. For example, a plant with an LAI of 2 has leaves that can cover a given area twice. Thus, LAI estimates the total canopy area, including the understory layers.
LAI is a collective measure of the foliage in a canopy. It emphasizes the importance of canopy surface area in vegetation-environment interactions. LAI is a parameter of the canopy surface area, where most of the plant’s energy exchange (photosynthesis and respiration), gas exchange (photosynthesis, transpiration, and respiration), and water exchange (transpiration) with the environment occur.
Subscribe to the CID Bio-Science Weekly article series.
By submitting this form, you are consenting to receive marketing emails from: . You can revoke your consent to receive emails at any time by using the SafeUnsubscribe® link, found at the bottom of every email. Emails are serviced by Constant Contact
LAI is used to scale leaf-level plant functions up to the canopy, crop, and even regional levels. Therefore, LAI has become a central vegetation parameter in large-scale estimates of plant processes in ecosystem, earth system, and climate change studies.
Factors Influencing LAI
LAI is variable across space and time. The LAI of a single plant can change over its entire lifecycle. Anything that affects plant growth and health will affect LAI. Also, its functions and structure are affected by microsite and weather conditions, nutrient availability, herbivores, and human activities.
The spatial scale at which LAI is measured must also be considered, as the canopy is organized at the branch, crown, and stand levels. LAI has site, stand, and species attributes such as surface area density within crowns, crown size, and stand density.
The factors that influence LAI will vary depending on the scale at which it is studied.
- Plant level: Intrinsic plant features play a significant role, including species, life strategies, vertical organization of leaves, horizontal spread, growth phase, leaf inclination, woody component, and plant height, which can affect the calculated LAI.
- Stand level: Factors such as leaf form, leaf type, phenology, plant density, stand structure, clumping or distribution of plants/trees, canopy rugosity, position within vertical and light gradient, and local site conditions will influence LAI.
- Large-scale: Seasonal leaf shedding, climate, moisture availability, leaf form, leaf type, phenology, forest type, and forest disturbances influence LAI at large scales. Remotely sensed LAI estimates can be affected by elevation, temperature, and precipitation.
Why is LAI Important?
LAI has become important in crop, ecosystem, and climate change studies for several reasons, including its link to critical plant physiology, its suitability for ecosystem studies, its compatibility with remotely sensed data, and its suitability for comparisons.
LAI link to plant physiology
Leaves are the sites where plants intercept light and take in carbon dioxide, which determines the rates of photosynthesis, biomass production, and productivity. Nearly 90% of the biomass (or dry matter) of a plant is produced by leaves.
During respiration, oxygen is taken in, carbon dioxide (CO2) is released through stomata, and water vapor is lost through transpiration, mainly from leaves. Hence, LAI can be used to measure gas exchange rate, evapotranspiration, water-use efficiency, nutrient-use efficiency, and leaf biomass. Models are based on single or multiple layers, taking into consideration the 3-D distribution of leaf surfaces, canopy structure, and light interaction.
Useful to understand ecosystem processes
LAI helps understand all the impacts of plant physiological processes at the ecosystem level. It provides insights into water and carbon fluxes and biogeochemical processes and is considered a driver of forest productivity. Changes in LAI can reflect biotic and abiotic stressors such as drought, frost, defoliation, nutrient deficiency, and management practices. So, LAI is used in process-based ecosystem models to quantify productivity in agricultural and forest ecosystems.
A few global-level LAI estimates have been made for use in regional and global models to understand plant-atmosphere exchanges of energy, water vapor, carbon dioxide, and other materials. The global LAI is 4.5. The highest LAI was recorded in plantations, followed by temperate evergreen forests, wetlands, and the lowest in deserts and tundra. The average LAI, except for deserts and tundra, lies between 3 and 19.
Use in comparisons
The unitless LAI is widely used to compare vegetation across different systems and scales. It is possible to compare canopies of other trees, crops, or even ecosystems. Moreover, variations in the sample area do not affect the parameter.
Remote sensing models
Remotely sensed data, for example, from satellites that always use indirect measurements, are based on the reflection of solar radiation by the canopy, and give the average LAI for a pixel.
Many ecosystem production models do not use total LAI, and these remotely sensed averages are sufficient to classify vegetation into different lifeforms, biomes, and land-use classes, since LAI depends on plant lifeform, height, leaf type, stress, site conditions, and climate.
Some weaknesses of LAI
LAI is a common vegetation characteristic; however, Parker (2020) warns that scientists using it should be aware of some of its weaknesses, which are as follows:
- Scaling processes that depend on leaf area, when aggregated, can be misleading.
- LAI values are not the only driver of biomass or production.
- Leaf area organization in space and the gradients that arise from microclimates are more critical than the total leaf area.
- LAI values in large-scale studies can be the aggregate of many species and, therefore, plant strategies.
- LAI beyond 3 is not essential to quantify ecosystem production and processes. Higher values may be more relevant for other ecosystem processes.
Despite these weaknesses, LAI is often a key biophysical variable used in biogeochemical, hydrological, and ecological models. Leaf area index is also commonly used as a measure of crop and forest growth and productivity, and climate change at spatial scales ranging from the plot to the globe.
LAI for Agriculture Research
LAI is used to estimate physiological processes, especially photosynthesis, evapotranspiration, and crop yield in agricultural studies.
LAI varies with the canopy architecture, which depends on the cultivars, geography, and field cultural practices. Some differences arise from the types of crops and fruits. Crop simulation models use LAI to predict yield, because it can predict productivity, nutrient and irrigation needs, and incidences of stress:
Productivity: Leaves intercept light and CO2 and are the site of photosynthesis, which determines biomass production and yield. So, LAI is used to predict yield. However, the relationship between LAI and yield is not linear; increasing LAI doesn’t necessarily boost yield. When LAI increases, many leaves are shaded and have low photosynthetic rates, yet respiration and transpiration continue. For example, a 40% increase in LAI yields only a 3% increase in soybean yield. The part of the plant harvested as food will also determine the relationship between LAI and yield.
- Leaf as Yield: In the case of crops where the leafy parts are desirable, as in lettuce and spinach, maximizing LAI is of direct benefit. When fruits or seeds are the yield, LAI’s influence can vary.
- Fruits: When the tree is younger, increasing LAI will boost fruit yield. However, if the canopy becomes too dense, preventing light from reaching lower levels and developing fruits, both yield quantity and quality will decrease in older fruit trees, as seen in oranges. Hence, pruning is used to optimize the leaf-to-fruit ratio by reducing LAI.
- Vegetables: In many vegetables, higher photosynthesis is linked to higher yield. Therefore, a higher LAI is needed. In vegetables such as tomatoes, decreasing LAI can impact biomass accumulation and yield. However, it is essential to maintain only the optimum LAI, as increasing LAI beyond a certain point will not increase yield. Depending on the variety, an LAI of 3-4 is suitable for tomatoes.
- Cereals: In cereals, LAI determines biomass accumulation. However, an optimum LAI is sometimes a better goal, depending on the cereal variety, as increasing LAI may not increase photosynthesis due to shading but does increase respiration. In rice, increasing LAI and photosynthesis are the goals, but in sorghum, the relationship between LAI and yield is high but negative, as LAI increases, yield decreases.
Irrigation management: LAI is linked to transpiration and water-use efficiency. As LAI increases, transpiration increases. So, research on crop breeding for optimal LAI and on best management practices can increase crop water-use efficiency.
Fertilizer application: Research into optimum nutrient amounts and timing to increase yield also uses LAI to reflect the impact on leaves and their physiological processes.
Health indicator: Leaf area is directly affected by pests and diseases and by abiotic stressors such as drought and heat, thereby reducing yield. LAI is used to identify evidence of biotic and abiotic stress.
LAI for Precision Agriculture
Besides research, LAI is used in everyday applications in precision agriculture because of its links to plant physiological processes and its accurate estimation from remotely sensed data at large scales. Also, LAI variation with crop, cultivar, field conditions, and crop stage is leveraged. Thus, LAI is used to bridge remote sensing observations to quantify various plant processes and conditions.
High-resolution LAI spatial data, analyzed using AI and machine learning models, provides insights into crop growth, health, and yield that farmers can use to make informed decisions. LAI supports the use of variable-rate technology (VRT) to precisely apply inputs such as fertilizer, water, and pesticides, thereby minimizing overuse and runoff.
LAI is used in precision agriculture for several purposes to improve crop management, cut labor and input costs, improve yield, and ROI:
Monitor growth: LAI increases as crops grow. Measuring growth through greenness and vegetative indices (VIs) enables farmers to track crop growth and identify problems.
Regulate nutrients and irrigation: LAI can also diagnose nitrogen status in cereals using satellite imagery, enabling timely fertilizer applications to boost yield. Similarly, LAI is used to regulate irrigation.
Identify stress: Loss of leaves due to pests, diseases, poor nutrition, and irrigation management can be identified and quantified to support micro-site management.
Yield prediction: Crop LAI is used to assess crop productivity and predict potential yield, which is helpful for marketing and harvest management.
Studies show that LAI is consistently positively correlated with vegetative indices (VIs) across crop types, regions, and time. The global LAI-VI relationship can explain over 50% of the variance in field LAI using remote data across large spatial scales, with a precision of ~1 m2/m2. So, precision agriculture is possible even in areas where in situ LAI data are lacking.
LAI and Forest Productivity and Dynamics
LAI provides a means to measure the exchange of energy, water, and carbon between forest canopies and the environment. LAI, an indicator of canopy foliage, is used to estimate primary production in forests and other ecosystems.
Forests have a complex vertical organization due to multiple storeys. Leaves exist in a continuum of microclimates, both vertically and horizontally. The outer canopy is exposed to solar radiation, has a higher photosynthetic rate, and contributes more to productivity. The lower branches of the top canopy have lower productivity because they are located in dimmer microclimates and contribute less to productivity.
However, high LAI can support other vital ecosystem functions, such as promoting biodiversity. High LAI creates various microclimates (or niches) by determining the amount of light and water interception. The dimmer understorey supports shade-tolerant trees, saplings for forest recruitment, and non-arborescent plants like ferns, herbs, grasses, and shrubs. LAI can be used to understand the vertical distribution of foliage and the insect and fauna it supports.
Forest dynamics that use leaf area and light interception among various crown levels (forest stratification) rely on LAI to study competitive and facilitative interactions, stand recruitment, sapling growth, and mortality. Site studies can be aggregated to larger scales.
Precision Forestry
LAI is used to monitor the growth, health, pest attacks, drought, and productivity of forests and plantations using large-scale remote data, as in precision farming. Precision forestry enables better forest management for timber production or conservation. LAI also helps foresters
- Identify and quantify deforestation to reduce illegal logging
- Track seedling establishment and forest recruitment
- Identify pest and herbivore damage
- Monitor and control forest fire losses
- Quantify forest productivity
- Evaluate the effectiveness of forest restoration projects; see Figure 1
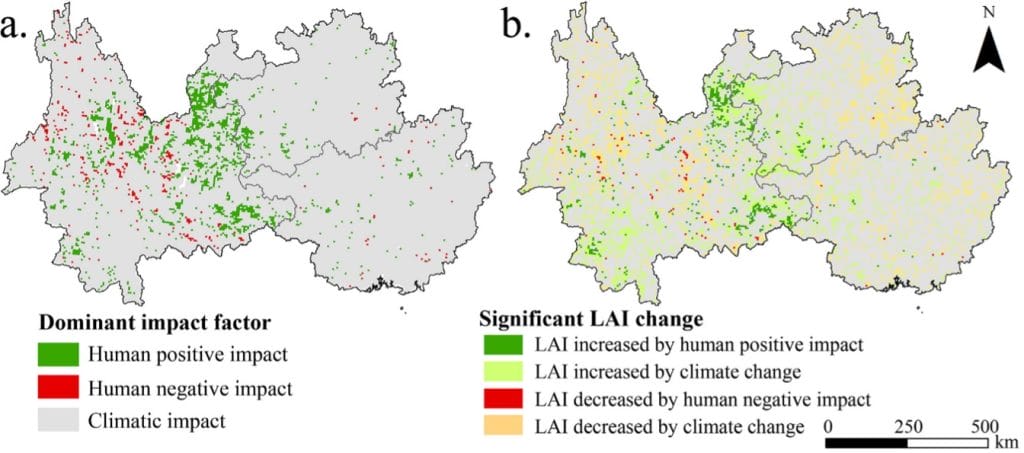
Figure 1: Changes in forests LAI due to restoration and climate change in SW China, Peng et al. 2021. (Image credits: https://doi.org/10.1016/j.scitotenv.2020.144297)
LAI for Climate Change Studies
LAI is used as an indicator of carbon assimilation, fixation, and respiration, and is therefore a crucial variable for climate change research.
- Climate models: These use large-scale LAI data to predict the effects of climate change on future vegetation and its processes. For example, climate models such as BIOME-BGC, a biogeochemical model that simulates processes like photosynthesis, respiration, evapotranspiration, and carbon allocation, predict LAI across seven biomes.
- Change in vegetation: LAI is also used to track changes in forests and crops due to climate change using satellite imagery, as shown in Figure 1.
- Carbon fluxes: LAI affects carbon assimilation and fixation rates, so it is used in studies and models to quantify carbon fluxes, including carbon dioxide fertilization, productivity, and total biomass in crops and forests.
Measuring LAI
LAI can be measured directly or indirectly in the field and through remote sensing.
Direct Methods: In direct field methods, the leaves serve as the basis for measurement. These methods are time-consuming and complex because they require collecting leaves and measuring leaf area. The leaves can be collected:
- Destructively by harvesting.
- Non-destructively by collecting leaf litter in traps on the ground.
The leaf area is estimated by three means:
- Leaf measurement: In this method, leaf area is measured manually. This is inefficient and expensive.
- Planimetric method: Leaf perimeter is measured by a planimeter, the area of leaves is derived, and their ratio to the ground is calculated.
- Gravimetric method: This method uses the relationship between biomass and the leaf area to calculate the LAI. Biomass is estimated by finding the dry weight of leaves.
Indirect Methods: Indirect LAI calculation in the field can be non-contact, fast, and automated, and is, therefore, gaining popularity.
- Inclined point quadrat: The vegetation canopy is measured by counting the number of contacts made by a needle in a given quadrat. This is time-consuming and suitable only for crops up to 1.5 meters high.
- Hemispherical photography: Perhaps the most accurate method for measuring leaf area index uses photography from either below or above the canopy.
Remote-sensed data: Large-scale, satellite- or drone-based estimation of LAI uses indirect approaches and relies on solar radiation reflected by the plant canopy at various wavelengths, which models and VIs analyze. Remote reflectance is also used in multiple global models.
Each method has its advantages and disadvantages, and the choice depends on the study’s aim. Direct methods are more accurate. Indirect methods tend to underestimate LAI due to nonrandom leaf distribution within the canopy, the contribution of woody elements, tree clumping, and seasonality.
Choosing the Right Tools
Some methods and tools are more popular. Hemispherical photography is the most widely used technique in the field to measure LAI. Among several hemispherical photography tools, the CI-110 Plant Canopy Analyzer has been evaluated by scientists as overcoming some of the concerns of LAI estimations, such as leaf inclination, non-random leaf distribution, and the canopy extinction coefficient.
Contact us at CID BioScience Inc. to learn more about the CI-110 Plant Canopy Imager for your LAI research needs.
Sources
Asner, G. P., O. Scurlock, J. M., & Hicke, J. A. (2003). Global synthesis of leaf area index observations: Implications for ecological and remote sensing studies. Global Ecology and Biogeography, 12(3), 191-205. https://doi.org/10.1046/j.1466-822X.2003.00026.x
Bréda, N. J. (2003). Ground‐based measurements of leaf area index: A review of methods, instruments and current controversies. Journal of Experimental Botany, 54(392), 2403-2417. https://doi.org/10.1093/jxb/erg263
Chen, J. M., Rich, P. M., Gower, S. T., Norman, J. M., & Plummer, S. (1997). Leaf area index of boreal forests: Theory, techniques, and measurements. Journal of Geophysical Research: Atmospheres, 102(D24), 29429-29443. https://doi.org/10.1029/97JD01107
Ewert, F. (2004). Modelling plant responses to elevated CO2: how important is leaf area index? Annals of botany, 93(6), 619-627.
Fang, H., Baret, F., Plummer, S., & Schaepman-Strub, G. (2019). An Overview of Global Leaf Area Index (LAI): Methods, Products, Validation, and Applications. Reviews of Geophysics, 57(3), 739-799. https://doi.org/10.1029/2018RG000608
Kang, Y., Özdoğan, M., Zipper, S. C., Román, M. O., Walker, J., Hong, S. Y., Marshall, M., Magliulo, V., Moreno, J., Alonso, L., Miyata, A., Kimball, B., & Loheide, S. P. How Universal Is the Relationship between Remotely Sensed Vegetation Indices and Crop Leaf Area Index? A Global Assessment. Remote Sensing, 8(7), 597. https://doi.org/10.3390/rs8070597
Parker, G. G. (2020). Tamm review: Leaf Area Index (LAI) is both a determinant and a consequence of important processes in vegetation canopies. Forest Ecology and Management, 477, 118496. https://doi.org/10.1016/j.foreco.2020.118496
Patil, P., Biradar, P., Bhagawathi, A. U., & Hejjegar, I. S. (2018). A review on leaf area index of horticulture crops and its importance. Int. J. Curr. Microbiol. App. Sci, 7(4), 505-513.
Peng, J., Jiang, H., Liu, Q., Green, S. M., Quine, T. A., Liu, H., Qiu, S., Liu, Y., & Meersmans, J. (2021). Human activity vs. Climate change: Distinguishing dominant drivers on LAI dynamics in karst region of southwest China. Science of The Total Environment, 769, 144297. https://doi.org/10.1016/j.scitotenv.2020.144297
Qiao, K., Zhu, W., Xie, Z., & Li, P. Estimating the Seasonal Dynamics of the Leaf Area Index Using Piecewise LAI-VI Relationships Based on Phenophases. Remote Sensing, 11(6), 689. https://doi.org/10.3390/rs11060689
Ramezani, M.R., Massah Bavani, A.R., Jafari, M. et al. (2020). Investigating the leaf area index changes in response to climate change (case study: Kasilian catchment, Iran). SN Appl. Sci. 2, 501. https://doi.org/10.1007/s42452-020-2
Related Products
Most Popular Articles
- Transpiration in Plants: Its Importance and Applications
- Leaf Area – How & Why Measuring Leaf Area…
- How to Analyze Photosynthesis in Plants: Methods and Tools
- Plant Respiration: Its Importance and Applications
- The Forest Canopy: Structure, Roles & Measurement
- Stomatal Conductance: Functions, Measurement, and…
- Forest & Plant Canopy Analysis – Tools…
- Root Respiration: Importance and Applications
- The Importance of Leaf Area Index (LAI) in…
- 50 Best Universities for Plant Science


