Transpiration, Evapotranspiration, and Leaf Area Index
Dr. Vijayalaxmi Kinhal
May 31, 2022 at 10:09 pm | Updated May 31, 2022 at 10:09 pm | 6 min read
Transpiration is known to provide a significant amount of terrestrial evapotranspiration. However, scientists have not agreed on the exact transpiration contribution to evapotranspiration. It is crucial to estimate this relationship to determine how the global water cycle is affected.
Why Evapotranspiration is Important
Around 67% of rainfall returns to the atmosphere through evapotranspiration, a vital component of the global water cycle.
We know that evapotranspiration increases due to rising temperatures to change precipitation patterns. Wet regions are becoming wetter and dry areas, drier. We are also experiencing more extreme weather and storms as more water vapor enters the atmosphere.
Subscribe to receive our monthly round-up of articles.
Estimating evapotranspiration will be more and more necessary to understand the changing global hydrological cycle.
What is terrestrial evapotranspiration?
Terrestrial evapotranspiration (ET) is the sum of evaporation from four sources- transpiration (T) from plants, soil and open water (E), and canopy intercepted water (I).
Why do transpiration estimates vary?
Of these four parts, transpiration accounts for the majority of terrestrial evapotranspiration. But the estimations of transpiration’s contribution to global evapotranspiration vary significantly- from 24% to 90%!
One reason is the different methodologies scientists use, and another is a matter of scale. Conclusions from in situ studies are difficult to compare with large-scale estimations.
Studies using the isotope approach usually report higher transpiration values than meteorological and sap measurements, as shown in Figure 1.
There is a difference in the ratio of water isotopes evaporated from land and water and transpired water from plants. A catchment-scale study (Jasechko et al., 2013) used the differences in oxygen (18O/16O) and hydrogen (2H/1H) isotope ratios to differentiate evaporation from lakes and rivers and transpiration. They concluded that 80-90% of the water vapor comes from transpiration.
Another study (Good et al., 2015), using satellite measurements of D/H isotope ratios of water, found transpiration accounts for 64% of evapotranspiration. This study found that soil evaporation is more important than open water surfaces.
It is only recently that transpiration contributions have been estimated directly from vegetation, but this is proving to be an effective method.
Remotely Sensed Forest Cover
One such study used satellite data of parameters that had global relevance. Miralles et al. (2011) used the model GLEAM (Global Land-surface Evaporation: the Amsterdam Methodology) to study spatial and temporal variations and partitioning of evapotranspiration.
The model has four modules to estimate precipitation over the root zone, stress conditions, vegetation, and evaporation from intercepted rainfall. The vegetation was classified as tall canopy and short vegetation; a third category with bare soil or no vegetation was also included.
The study found transpiration contributes 80% to evapotranspiration, interception loss contributes 11%, bare soil evaporation comes in at 7%, and snow sublimation rounds out the field at 2%. However, there are variations in contributions to evapotranspiration made by each component in different ecosystems and continents, as shown in Figure 2.
Using Leaf Area Index
While the afformentioned global-scale evapotranspiration partitionings are convenient, they are not linked to insights from field data. Thus a significant contingent of scientists consider them inaccurate without the backup of field measurements.
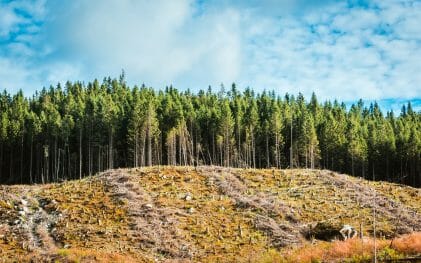
Transpiration typically varies based on vegetation type, influenced by season, geographical location, time of day, and cloud cover. Anthropogenic activities such as deforestation, land-use changes, and climate change also affect transpiration from any ecosystem.
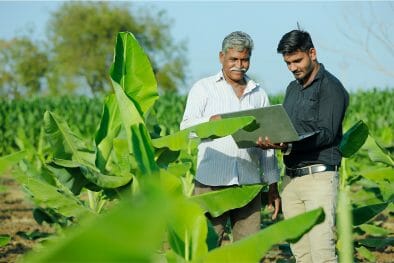
The vegetation parameters that are usually tracked are leaf area index and canopy cover, as they provide information on the total transpiring area and stomatal conductance and regulation. Gas exchange measurements give direct estimations of transpiration, for which portable field tools like the CI-340 Handheld Photosynthesis System are helpful.
Wang et al. (2014) reviewed 48 studies, which covered all the continents, to find the effect of natural and agricultural land areas to find out what effect vegetation has on transpiration. The review used Leaf Area Index (LAI), the one-sided leaf area per unit area, to estimate transpiration and evapotranspiration.
The hand-held CI-110 Plant Canopy Analyzer, which takes images from beneath the canopy, uses a hemispherical lens, and automatically calculates canopy leaf area index, is ideal for non-destructive and rapid measurements in the field.
Wang et al. found that transpiration contributed between 38 and 77% of ET from the synthesis. Even when the leaf area index value was low, transpiration was high. Agricultural lands had higher transpiration rates than natural vegetation. Since crops are irrigated, they suffer less water stress and have more transpiration.
Again, there is an extensive range in transpiration seen in agricultural fields. Early growing plants showed less transpiration than later stages of a crop under similar leaf area index. The two parameters, leaf area index and growing season, could explain 43% of the variation in transpiration rates.
This estimate was global in scope but used individual studies for its conclusion.
Scaling Up Leaf Area Index Estimations
Comparing field studies to global assessments is not possible. To solve this problem, and others, such as overestimations by satellite-based estimations, Wei et al. (2017) proposed a way to upscale published site measurements.
Site measurements have already shown that leaf area index is a good predictor of transpiration. So the scientists developed an evapotranspiration partitioning algorithm based on leaf area index.
The scientists constructed a regression equation to establish the relationship between transpiration and leaf area index for 17 ecosystems derived from 64 individual studies. The vegetation types were classified as croplands, broad-leaf forests, needle-leaf forests, mixed forests, shrubs-grasses, and wetlands. Leaf area index variations between regions were due to weather, soil moisture, season, and short temporal differences, with croplands showing the highest transpiration.
The scientists also integrated evapotranspiration and interception loss estimations from three land surface and remote sensing models to derive global ratios.
This model showed that transpiration accounts for 57.2% of evapotranspiration, with a range of 42.9% to 74.9%. The greatest transpiration T/(E+T) is seen in areas with high leaf area index, such as rainforests. There is also a latitudinal variation, with transpiration decreasing from the equator towards the poles.
The authors found that uncertainties for global estimations which arise from variation between ecosystem types, plant morphology, and physiology were minor. So, this model that combines site measurements and global model estimations is useful. The availability of leaf area index data from satellite imagery is an advantage that can help in rapid assessments of transpiration contributions from other ecosystems.
Fine-Tuning Transpiration Estimations
Studies incorporating field measurements of meteorology, soil moisture, and vegetation estimate transpiration to be around 55% of ET. Many issues, like separating the contribution of understory and top canopy in satellite estimation of leaf area index and accurate analyses of interception losses must still be overcome. Evapotranspiration estimation could also be improved by finalizing the proportion of transpiration contribution.
Moreover, scientists are not sure what effect climate change has on transpiration. Some argue that rising CO2 levels stimulate vegetative growth and leaf area, leading to more transpiration and evapotranspiration. While others think the higher temperatures cause stomata to close partially and reduce transpiration.
Knowing how transpiration and evapotranspiration are changing will help people develop proper water management strategies for an evolving planet.
—
Vijayalaxmi Kinhal
Science Writer, CID Bio-Science
Ph.D. Ecology and Environmental Science, B.Sc Agriculture
Sources
Abtew, W., & Melesse, A. (2013). Climate Change and Evapotranspiration. In: Evaporation and Evapotranspiration. Springer, Dordrecht. https://doi.org/10.1007/978-94-007-4737-1_13
Good, S. P., Noone, D., & Bowen, G. (2015). Hydrologic connectivity constrains partitioning of global terrestrial water fluxes. Science, 349(6244), 175-177. doi:10.1126/science.aaa5931
Jasechko, S., Z. D. Sharp, J. J. Gibson, S. J. Birks, Y. Yi, & Fawcett, P. J. (2013), Terrestrial water fluxes dominated by transpiration, Nature, 496(7445), 347– 350.
Miralles, D. G., Holmes, T. R. H., De Jeu, R. A. M., Gash, J. H., Meesters, A. G. C. A., & Dolman, A. J. (2011). Global land-surface evaporation estimated from satellite-based observations, Hydrol. Earth Syst. Sci., 15, 453–469, doi:10.5194/hess-15-453-2011.
Miralles, D. G., De Jeu, R. A., Gash, J. H., Holmes, T. R., & Dolman, A. J. (2011). Magnitude and variability of land evaporation and its components at the global scale. Hydrology and Earth System Sciences, 15(3), 967–981. https://doi.org/10.5194/hess-15-967-2011
Pan, S., H. Tian, S. R. S. Dangal, Q. Yang, J. Yang, C. Lu, B. Tao, W. Ren, and Z. Ouyang (2015), Responses of global terrestrial evapotranspiration to climate change and increasing atmospheric CO2 in the 21st century, Earth’s Future, 3, 15–35, doi:10.1002/2014EF000263.
Schlesinger, W. H., & S. Jasechko (2014), Transpiration in the global water cycle, Agric. For. Meteorol., 189–190, 115– 117.
Wang, L., Good, S. P., & Caylor, K. K. (2014). Global synthesis of vegetation control on evapotranspiration partitioning. Geophysical Research Letters, 41(19), 6753-6757.
Wei, Z., Yoshimura, K., Wang, L., Miralles, D. G., Jasechko, S., & Lee, X. (2017). Revisiting the contribution of transpiration to global terrestrial evapotranspiration. Geophysical Research Letters, 44(6), 2792–2801. https://doi.org/10.1002/2016gl072235
Related Products
Most Popular Articles
- Transpiration in Plants: Its Importance and Applications
- Leaf Area – How & Why Measuring Leaf Area…
- How to Analyze Photosynthesis in Plants: Methods and Tools
- Plant Respiration: Its Importance and Applications
- The Forest Canopy: Structure, Roles & Measurement
- Stomatal Conductance: Functions, Measurement, and…
- Forest & Plant Canopy Analysis – Tools…
- Root Respiration: Importance and Applications
- 50 Best Universities for Plant Science
- The Importance of Leaf Area Index (LAI) in…