Chlorophyll Analysis Using Vegetation Indices
Scott Trimble
November 7, 2020 at 5:49 am | Updated November 7, 2020 at 5:49 am | 7 min read
Instruments like the VIS-NIR based CI-710 Miniature Leaf Spectrometer (CID Bio-Science) aid in non-destructive data collection and quantification of chlorophyll. Several vegetation indices can be used to analyze the spectral data collected by the spectrometer during the process. Chlorophyll content estimation assumes importance as it can provide rapid and precise data on the plant physiological parameters monitored in current precision and smart farming technologies.
Leaf Pigments
Chlorophyll is the most abundant and important pigment in a leaf. It is important due to its role in photosynthesis, but also because it can be an indicator of plant health and nutrient status.
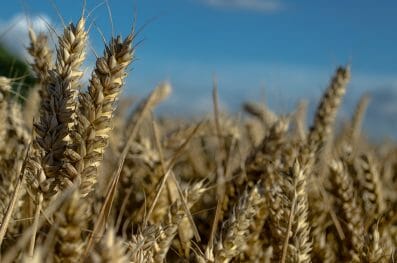
Chlorophyll levels are the basis for estimating plant growth rate in precision farming and the response to soil, water, and nutrient conditions.
Subscribe to receive our monthly round-up of articles.
Chlorophyll levels indicate plant nutrient status as many elements—mainly nitrogen, but also iron and magnesium—are needed to produce it. This can show if plants are getting sufficient fertilizers and manure. A deficiency of N results in less production of chlorophyll and yellowing of leaves. As this can affect the rate of photosynthesis and biomass accumulation, the ultimate yield of the crop can be impacted.
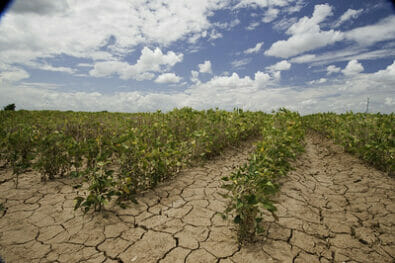
Changes in chlorophyll levels can also be an indicator of plant health problems. Pests and disease symptoms will decrease leaf area or cause changes in the amount of chlorophyll in leaves. Similarly, water stress will dry leaves and turn them brown, changing greenness levels.
Chlorophyll Spectral Signature
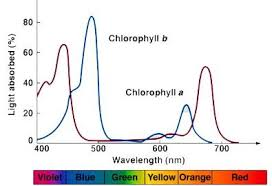
Figure 1. Light absorption by Chlorophyll-a and Chlorophyll-b. (Image credits: https://accmultimedia.austincc.edu/biocr/1406/labm/ex7/prelab_7_4.htm)
There are two chlorophyll pigments: chlorophyll-a and chlorophyll-b.
Chlorophyll-a is the principal pigment involved in photosynthesis. It absorbs light mainly in orange-red color at wavelengths 429 nm and 659 nm (violet-blue), and it reflects a blue-green color. It is mainly responsible for the green in leaves as it accounts for ¾ of all chlorophyll.
Chlorophyll-b passes on the light energy it captures to chlorophyll-a. It is not found in all plants and accounts only for ¼ of the pigment in any plant. Its peak absorbance is violet-blue light at 455 nm with a smaller peak at 642 nm.
Thus, chlorophyll has two absorption peaks in the blue and red regions.
Healthy plants reflect more green and absorb more red, but plants suffering stress reflect more at the red-edge or in the blue spectrum.
Spectrometers Can Measure Chlorophyll
Of all the compounds in the leaves, pigments have a strong response to light and can be measured easily by spectrometers.
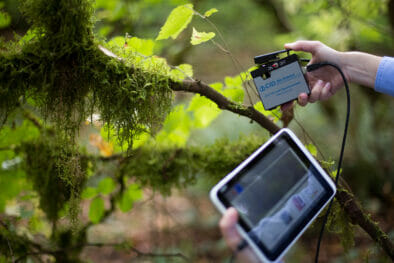
The CI-710 Miniature Leaf Spectrometer is widely used in plant research for the precision and rapid measurements it offers. It uses light in the VIS-NIR spectra between 360-1100nm, and it can analyze multiple discrete peaks simultaneously with the accompanying SpectraSnap! software. The device can record absorbance, reflectance, and transmission of light to quantify chemicals and pigments.
The device analyzes the recorded spectral data to estimate crop properties using thirty-one scientific and published vegetation indices (VIs). Around twenty-nine indices analyze reflectance, and two analyze absorbance. Some physiological processes that indices can track with spectral data are
- greenness estimated by Normalized Difference Vegetation Index (NDVI),
- plant stress by Plant Senescence Reflectance Index (PSRI),
- and leaf water status as a measure of drought by the Water Band Index (WBI).
The relevance of individual vegetation indices for measuring these physiological parameters will depend on the species, due to their habit, structure, size, color, etc. Therefore, the same index or just one index may not be suitable across species and even varieties.
The choice of indices and the particular spectrum to study physiological characteristics for each species must be individually tested by scientists.
VIs for Eucalyptus Species
Vegetation indices’ estimation of chlorophyll content has been correlated to leaf nitrogen already in rice, maize, and grasses. However, this needs to be confirmed for eucalyptus (Eucalyptus spp).
Twenty-five-month-old clones of three hybrid eucalypti widely grown in commercial plantations were tested by Brazilian scientists, Ramalho de Oliveira, et al. from the Department of Forest Engineering, Federal University of Jequitinhonha and Mucuri Valleys, and Gerdau Florestal SA.
The three species tested were Eucalyptus urophylla × grandis (GG680 and GG682) and Eucalyptus urophylla × urophylla. Their leaves in the trees were found to vary in color and were classified into five groups using the Munsell Plant Tissue Color Chart. Thirty leaves from each of the five-color patterns were sampled.
The leaf spectral information was collected with the CI-710 Miniature Leaf Spectrometer (CID Bio-Science). Later, the leaves were oven-dried and the levels of nitrogen were estimated by the Kjeldahl method.
The leaf reflectance was analyzed by SpectraSnap! with an integration time of 300 milliseconds, 10 points of boxcar width, and two scans. The scientists tested the suitability of the following 13 vegetation indices:
- Normalized Difference Vegetation Index (NDVI)
- Red-edge Inflexion Point Position (IPP)
- Normalized Difference Red-Edge (reNDVI)
- Structure Insensitive Pigment Index (SIPI)
- Green Normalized Difference Vegetation Index (gNDVI)
- Photochemical Reflectance Index (PRI)
- Eucalyptus Pigment Index (EPI)
- New Reflectance Chlorophyll Index (NRIC)
- First Derivative (D1)
- Reciprocal Reflectance (RR)
- Modified Red-Edge Normalized Difference Vegetation Index Modified (mNDI)
- Green Chlorophyll Index (CIGreen)
- Red-edge Chlorophyll Index (CIRedEdge)
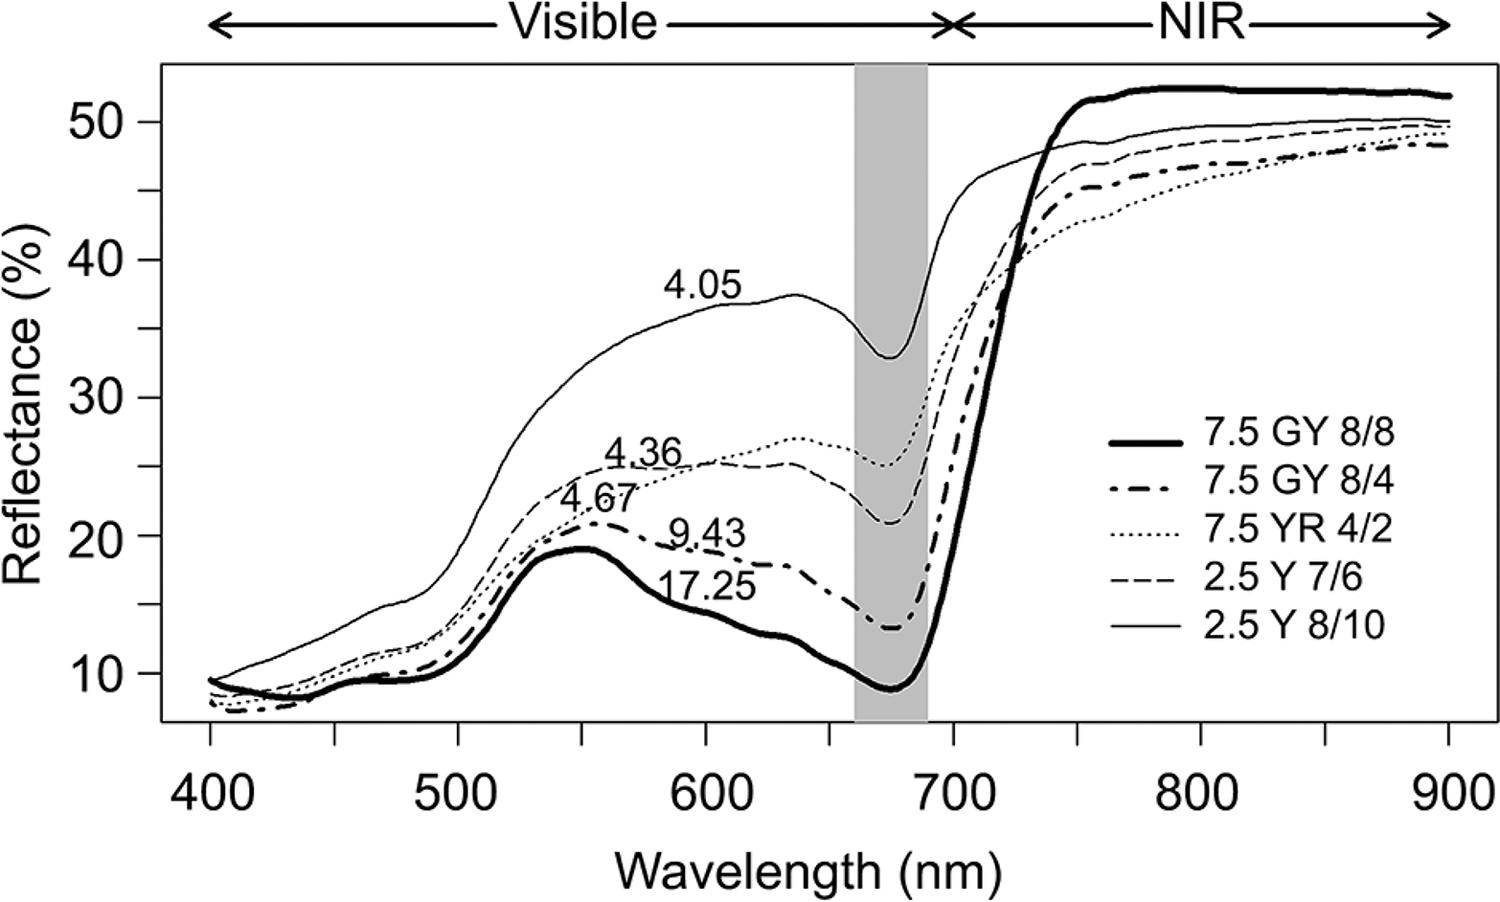
Figure 2: “Average spectral reflectance by foliar color pattern. Each curve represents the average of 270 samples of leaf reflectance. Numbers near the curves indicate the average of N concentration (g kg−1). NIR = Near-infrared,” Oliveira et al 2017. (Image credits: https://doi.org/10.1590/1678-992x-2015-0477)
In the visible light range, there was a negative correlation between the levels of nitrogen and reflectance. Green colored leaves with higher N concentrations showed lower reflectance for all wavelengths of the spectrum. Reflectance was highest on the red-edge, between the visible and NIR wavelengths (740 – 900 nm). Vegetation indexes were able to accurately estimate foliar N concentration based on this red-edge reflectance.
- The following were the VIs with the highest correlations to foliar N concentrations:
- Inflection Point Position (IPP, r = 0.97)
- Normalized Difference Red-Edge (reNDVI, r = 0.97)
- Modified Red-Edge Normalized Difference Vegetation Index (mNDI, r = 0.97)
Of the three VIs, the scientists found reNDVI consistently provided the best estimates of N concentration in all the different colored Eucalyptus leaves for the three species, Eucalyptus urophylla × grandis and two species of Eucalyptus urophylla × urophylla.
VIs for Leafy Vegetables
Alsina and her associates from the Latvia University of Agriculture decided to experiment with leafy vegetables, as non-destructive chlorophyll content estimation tends to mainly focus on field crops.
They chose to study two varieties of lettuce (Lactuca sativa cv ‘Lollo Bionda’ and cv ‘Lollo Rossa’), leaf mustard (Brassica juncea cv ‘Scala’), radish (Raphanus sativus cv ‘French breakfast’), and cabbage (Brassica oleracea cv ‘Rufus’).
The vegetables were grown in greenhouses with four combinations of LED lights: only natural light (control), sunlight supplemented with red, sunlight supplemented with blue, and a red/blue mixture.
The pigment content of their leaves was estimated two and a half months after planting. For each species, ten replicate non-destructive estimation was done by recording spectral data with the help of the CI-710 Miniature Leaf Spectrometer (CID Bio-Science) and several other devices. The scientists used the following twenty-one VIs incorporated in CI-710 to estimate chlorophyll content:
- Structure Intensive Pigment Index (SIPI)
- Chlorophyll Normalized Vegetation Index (CNDVI)
- Carter Indexes (CTR1, CTR2)
- Greening Index (G)
- Gitelson Merzlak Indexes (GM1, GM2)
- Lichtenthaler Indexes (LIC1, LIC20)
- Normalized Difference Vegetation Reflectance (NDVI)
- Normalized Pigment Chlorophyll Reflectance (NPCI)
- Normalized Pheophitinization Index (NPQI)
- Simple Ratio Pigment Index (SRPI)
- Triangular Vegetation Index (TVI)
- Transformed Carter Index (TCARI)
- Zarco-Tejada & Miller Index (ZMI)
- Modified Red-edge Simple Ratio Index (MRESRI)
- Red-edge Normalized Difference Index (reNDVI)
- Vogelman Red-edge Indexes (VREI1, VREI2, VREI3)
- Photochemical Reflectance Index (PRI)
- Plant Senescence Reflectance Index (PSRI)
- Water Band Index (WBI)
Also, the chlorophyll-a and chlorophyll-b contents, along with the total chlorophyll content, were estimated biochemically. The reflectance peak of the vegetables was found to occur at 605 nm and 696 nm in the visible range and in the near-infrared region (740–930 nm).
Of the twenty-one VIs used by CI-710, nine of them had a correlation of 90 and more with chlorophyll content. The following two VIs were the best estimators of total chlorophyll content and used reflectance at 680 and 430 nm:
- Normalized Difference Vegetation Reflectance Index (NDVI, r = 0.972)
- Simple Ratio Pigment Index (SRPI)
The scientists found that the majority of the VIs were more sensitive to chlorophyll-a due to the higher proportion in which they were present in comparison to chlorophyll-b.
Scientists found the VIs were more suited for green-leaved vegetables. For example, the VIs were more suited for green lettuce as opposed to red lettuce.
Correlation is highest between reflectance and chlorophyll values in the visible range for radish and in the NIR range for leaf mustard leaves. Correlations were least in cabbage seedlings.
The experiment showed that non-destructive methods can replace destructive biochemical chlorophyll estimation in leafy vegetables.
Use of New Devices
Though small and portable, devices like the CI-710 have miniaturized sophisticated technology and incorporate the latest scientific analytics by way of vegetation indices. They help researchers handle complex tasks in the field or greenhouses by conducting data collection and analysis at the same time within a matter of seconds. Experiments, such as the two described above, will need to be replicated for all crops and varieties to broaden the reach of precision and smart farming and make the information they provide powerful and accurate.
—
—
Vijayalaxmi Kinhal
Science Writer, CID Bio-Science
Ph.D. Ecology and Environmental Science, B.Sc Agriculture
Feature image courtesy of Motion Array
Sources
Alsia, I., Dma, M., Dubova, L., Šenberga, A., & Dais, S. (2016). Comparison of different chlorophylls determination methods for leafy vegetables. Agronomy Research 14(2), 309–316.
Lakna (2017). Difference Between Chlorophyll A and B. Retrieved from https://www.researchgate.net/profile/Lakna_Panawala/publication/316584030_Home_Science_Biology_Cell_Biology_Difference_Between_Chlorophyll_A_and_B_Difference_Between_Chlorophyll_A_and_B_Main_Difference_Chlorophyll_A_vs_Chlorophyll_B/links/59054d0b0f7e9bc0d58fb91b/Home-Science-Biology-Cell-Biology-Difference-Between-Chlorophyll-A-and-B-Difference-Between-Chlorophyll-A-and-B-Main-Difference-Chlorophyll-A-vs-Chlorophyll-B.pdf
Oliveira, L. F., Oliveira, M. L., Gomes, F. S., & Santana, R. C. (2017). Estimating foliar nitrogen in Eucalyptus using vegetation indexes. Scientia Agricola, 74(2), 142-147. doi:10.1590/1678-992x-2015-0477
Related Products
Most Popular Articles
- Transpiration in Plants: Its Importance and Applications
- Leaf Area – How & Why Measuring Leaf Area…
- How to Analyze Photosynthesis in Plants: Methods and Tools
- Plant Respiration: Its Importance and Applications
- The Forest Canopy: Structure, Roles & Measurement
- Stomatal Conductance: Functions, Measurement, and…
- Forest & Plant Canopy Analysis – Tools…
- Root Respiration: Importance and Applications
- 50 Best Universities for Plant Science
- The Importance of Leaf Area Index (LAI) in…