6 Essential Applications of Leaf Spectrometers
Dr. Vijayalaxmi Kinhal
September 29, 2022 at 7:22 pm | Updated October 7, 2022 at 6:21 pm | 8 min read
6 Essential Applications of Leaf Spectrometers
- Leaf spectrometers collect and analyze reflected, transmitted, or absorbed light to provide vital plant information.
- The parameters measured are chemical concentrations, color analysis, photochemical reactions, optical and physical properties of leaves, and the extinction coefficient of light.
- These properties are applied on various scales from leaf, and individual canopy, to large-scale measurements in research, precision agriculture, and precision forestry.
When light strikes leaves, that light is either reflected, transmitted, or absorbed. Each of these light interactions can be applied to deliver a better understanding of the internal, physiological processes of plants. Leaf spectrometers record spectral data, analyze it using chemometrics and preloaded vegetative indices, and provide crucial plant information in real-time in the field or laboratory. By replacing cumbersome analysis, where results were delayed in some cases by weeks, leaf spectrometers allow scientists, growers, and breeders to take quick action based on real-time data.
Subscribe to receive our monthly round-up of articles.
Leaf spectral information can be used to estimate plant characteristics such as pigment profiles, chemical concentrations, photochemical reactions, extinction coefficient of light, and optical and physical properties of leaves.
1. Quantifying Chemical Concentrations
Plant biocompounds absorb and reflect varying amounts of light at different wavelengths. It is possible to determine the amount of a compound–chlorophyll, starch, protein, water, sugars, minerals, etc.–in a leaf based on the different reflectance spectra of the compound.
Pigments absorb most of the light, around 90%, which falls in the visible spectrum (400–700nm). Water, the second largest absorber of light in plants, uses light in the shortwave-infrared (1000–3000nm) and some bands of NIR or near-infrared (700–1000nm). Plants transmit or reflect 90% of NIR wavelengths as only 10% is absorbed by structural carbohydrates, like lignin and cellulose, proteins, sugars, etc.
Quantifying chemicals like nitrogen, potassium, and several micronutrients helps determine plant nutrition and how well plants use nutrients in the soil in forests or the fertilizers in agricultural fields. It also helps in identifying deficiency or over-fertilization in soils. Since nitrogen is essential for various plant processes and is directly linked with productivity, it is one of the most critical applications of leaf spectroscopy.
Though there are overarching similarities in plant composition, leaf spectrometers are sensitive enough to pick up minute differences between species, see Figure1. Even though species identification is more accurate at the leaf level, this application of spectroscopy is also used at larger scales. It helps identify species and finds application in precision agriculture and forestry, and research.
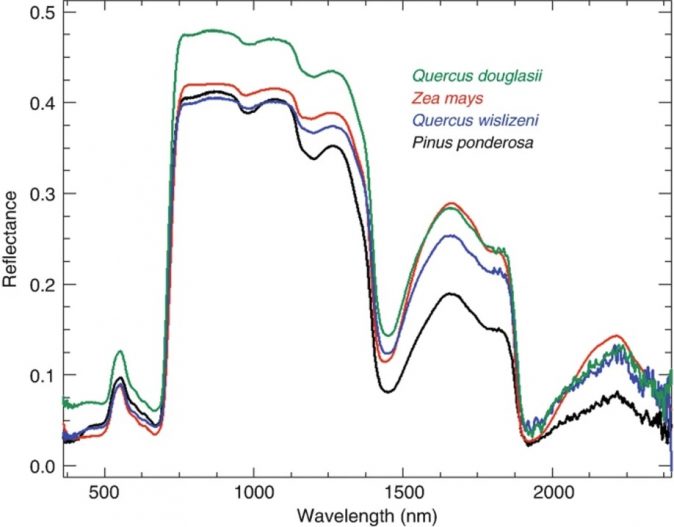
Figure 1: “Typical leaf spectra of evergreen and deciduous species, measured on field-grown leaves in June. Quercus douglasii (blue oak) is a deciduous dicot species, Zea mays (corn) is a deciduous monocot, Q. wislizeni (black oak) is an evergreen dicot species, and Pinus ponderosa (ponderosa pine) is a needle-leaf conifer,”. Ustin & Jacquemoud, 2020. (Image credits: https://link.springer.com/chapter/10.1007/978-3-030-33157-3_14)
2. Analyzing Color & Pigment
Pigments have the strongest spectral signature in plants because they absorb the most light. The amount of chlorophyll or anthocyanin and color change can provide scientists with information about the status and health of plants. Therefore leaf color analysis is a standard analytic tool in plant science and is widely used in agriculture research and practice, ecological research, and forest management.
Spectrometers’ color analysis provides precise information about leaf development, senescence, nutrition, light absorption, crop productivity, and fruit maturation. Changes in leaf color can be measure environmental stresses like light intensity, ultraviolet exposure, temperature, water stress, and biological stress like diseases and pests.
There are several vegetative indices that incorporate color analysis of leaves, especially chlorophyll, to measure plant status from productivity to stress and are widely used in precision agriculture.
3. Measuring Photochemical Reactions
Photosynthesis is a plant physiological process that uses light and influences spectra.
In the first stage, which is light-dependent, the reaction center, made up of chlorophyll molecules (P680) in Photosystem II, absorbs red light of 680nm wavelength and excites electrons by increasing their energy level. The released electron is passed on to PS I. The PSII splits water and transfers these electrons to bring the P680 back to its normal state.
The reaction center/chlorophyll (700) of PS I absorbs light of 700nm wavelength to release more electrons. The electrons transferred from PSII restore PSI to its normal state. In the next stage, the electron transfer produces two compounds- NADPH by reducing NADP and ATP through synthesis.
Thus energy from photons is converted to chemical energy ATP.
Only part of the light absorbed is used in the reaction. Part is emitted back as chlorophyll fluorescence and part as heat. Chlorophyll fluorescence occurs as red fluorescence (687nm) from PS II and far-red fluorescence or 760nm from PSI. Changes to 678 nm are measured by a ratio of far-red to red fluorescence, providing information on water stress. As stress increases, leaf spectrometers detect more red light.
4. Quantifying Leaf Optical & Physical Properties
Besides biochemistry, leaf characteristics like anatomy, structure, and orientation influence leaf interaction with light. However, these factors are not entirely understood.
The different spectra result from absorption and the scattering of the remaining light. Internally, the mesophyll structure or 3-D arrangement of tissues which will differ, for example, in monocots and dicots, will influence this scattering. As shown in Figure 2, the monocot leaves act as a single plate, while the more complex dicot leaves present several plates or layers through which light must traverse changing reflectance. This plate model is one of many models to explain leaf optical properties.

Figure 2: “Schematic representation of a monocot leaf (left) multiple reflections produced by a single plate. A dicotyledon leaf (right) and multiple reflections produced a single by a set of N = m + n plates, Jacquemoud, S. & Ustin, S. L. (Image credits: http://photobiology.info/Jacq_Ustin.html)
Externally, the leaf’s optical properties are also influenced by the cuticle structure, leaf hairs, the thickness of the leaf membrane, and its compounds like chloroplasts, thylakoids, and leaf wax.
Plants increase leaf wax as an adaptation when they want to reduce the amount of light absorbed to protect themselves from heat stress. Leaf spectrometers can measure this leaf wax to help scientists who wish to phenotype plants using this adaptation to climate-proof crop varieties. Alterations or damages in the membrane caused by acid rain will change the optical properties of plants and provide information on environmental stress.
Spectrometers pick up changes in quantities of chlorophyll in the membrane that increase reflectance and transmission and provide information on stress or other physiological phenomena like aging.
5. Measuring Refractive Index
Refraction is the deflection of light when it moves from one medium to another. When light moves from air into water, it slows down, changing its direction. Since the water content is high in leaves, leaves reflect light mainly due to the index of refraction between hydrated cell walls and intercellular spaces.
The NIR spectrum shows significant changes due to refraction and increases when there are more intercellular air spaces. Light gets scattered when it moves from hydrated cell walls with a refractive index of 1.47 to intercellular air spaces with a refractive index of 1.0. These intercellular spaces can depend on the ontogeny of crops. As cotton leaves grow older, there are more air spaces, increasing reflectance, and decreasing light transmission.
A study of thirty species of commercial crops, food, flowers, and rubber, found no relationship between leaf thickness and index of refraction—the complexity in the mesophyll arrangement of the leaf tissue was the determining factor.
The indirect estimation of refractive index by reflectance measurement could also measure leaf sap to estimate plant sugar levels and indicate how well the plant performs. More sugar production means a healthy plant, and poorer sap could point to problems in the field like nutrition and water management. Plants with a higher refractive index are fit and able to withstand diseases and pest attacks better. Scientists use the index in variety selection, harvest scheduling, and also to advise fertilizer application, irrigation, and postharvest management.
6. Estimating Extinction Coefficient
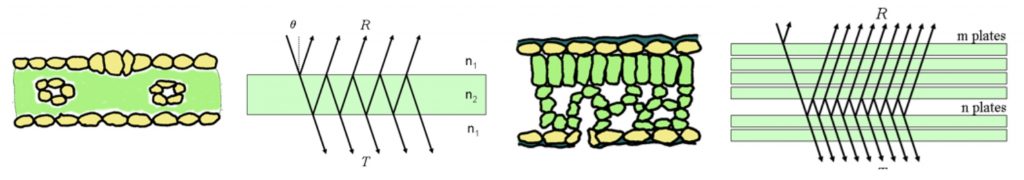
Figure 3: “Estimation of light extinction coefficient (k = 0.84) of the crop from the relationship between leaf area index (LAI) and transmittance of overall radiation through the canopy (RADi) at a plant density of 3 plants/m2,” Ta et al. 2011. (Image credits: https://link.springer.com/article/10.1007/s13580-011-0216-3)
Plant extinction coefficient (k) is the area of the shadow cast by a canopy on a horizontal surface divided by the area of leaves in the canopy, see Figure 3.
The light extinction coefficient of a crop can depend on the relationship between the leaf area index (LAI) and the amount of light transmitted through a canopy. The value of the light extinction coefficient is calculated using LAI and the difference in radiation above and below a canopy, based on Lambert-Beer’s law. K values are not sensitive to the angle of leaves.
Estimation of light interception is crucial as crop productivity depends on it. Lower K leads to better biomass production per unit of energy in the case of maize.
The light extinction coefficient of a crop depends on the canopy defined by genotype, row spacing, and planting density. Nutrients and water deficiency will also affect the K value.
The canopy light extinction coefficient for ecosystems affects carbon, water, and energy cycles. A study found that the K of 88 terrestrial ecosystems, including croplands, grasslands, shrublands, needle leaf forests, and broadleaf forests, all had the same average K of 0.56 during the growth season. However, the plant type mattered, and croplands had the highest K of 0.62. Next came broadleaf forests with K=0.59, followed by shrublands (K=0.56), grasslands (K=0.50), and needle leaf forests (K=0.45). There was no influence of precipitation, temperature, or LAI.
The Leading Leaf Spectrometer
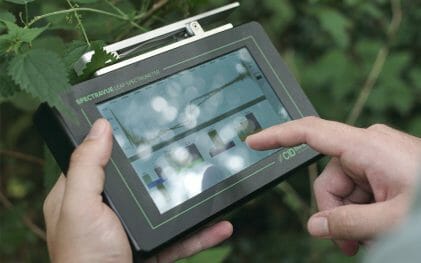
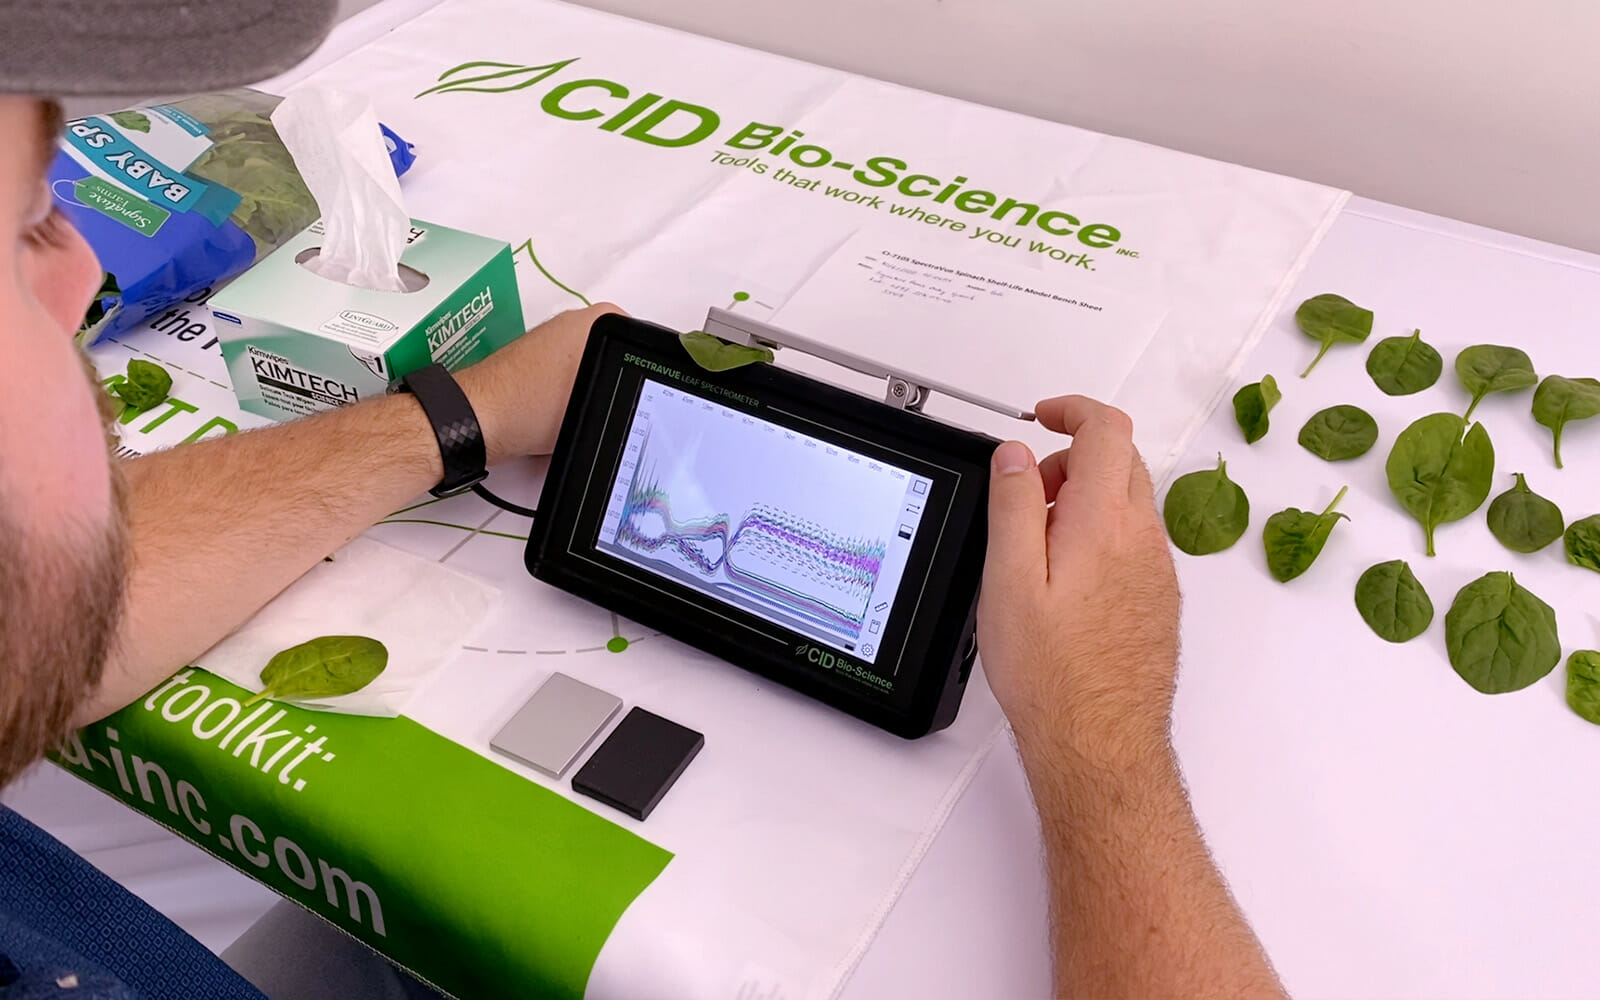
One of the leading leaf spectrometers available on the market is the CI-710s SpectraVue Leaf Spectrometer, produced by CID Bio-Science Inc. It records and analyzes the VIS-NIR spectra (360-1100nm) using the accompanying SpectraSnap! Software. The tool can measure light absorbance, reflectance, and transmission to estimate all of the above six leaf spectral parameters. Scientists use it widely in crop and ecological research.
To request more information about levelling up your own research with a SpectraVue Leaf Spectrometer, click here.
—
Vijayalaxmi Kinhal
Science Writer, CID Bio-Science
Ph.D. Ecology and Environmental Science, B.Sc Agriculture
Sources
Abeytilakarathna, P. D., Fonseka, R. M., Eeswara, J. P., & Herath, H. M. (2015). Refractive index and spectral reflection in three leaf categories of strawberry (Fragaria x Ananassa Duch.). Tropical Agricultural Research, 25(2), 261. https://doi.org/10.4038/tar.v25i2.8147
Campbell, G. S. (1986). Extinction coefficients for radiation in plant canopies calculated using an ellipsoidal inclination angle distribution. Agricultural and Forest Meteorology, 36(4), 317–321. https://doi.org/10.1016/0168-1923(86)90010-9
Curran, P. J., Dungan, J. L., Macler, B. A., Plummer, S. E., & Peterson, D. L. (1992). Reflectance spectroscopy of fresh whole leaves for the estimation of Chemical Concentration. Remote Sensing of Environment, 39(2), 153–166. https://doi.org/10.1016/0034-4257(92)90133-5
Jacquemoud, S. & Ustin, S. L. (n.d.). Modeling Leaf Optical Properties. Retrieved from http://photobiology.info/Jacq_Ustin.html
Gausman, H. W., & Allen, W. A. (1973). Optical parameters of leaves of 30 plant species. Plant Physiology, 52(1), 57–62. https://doi.org/10.1104/pp.52.1.57
Gausman, H. W., Allen, W. A., & Escobar, D. E. (1974). Refractive index of Plant Cell Walls. Applied Optics, 13(1), 109. https://doi.org/10.1364/ao.13.000109
Gill, S. C., & von Hippel, P. H. (1989). Calculation of protein extinction coefficients from amino acid sequence data. Analytical biochemistry, 182(2), 319–326. https://doi.org/10.1016/0003-2697(89)90602-7
Lacasa, J., Hefley, T.J., Otegui, M.E. et al. (2021). A practical guide to estimating the light extinction coefficient with nonlinear models—a case study on maize. Plant Methods 17, 60. https://doi.org/10.1186/s13007-021-00753-2
Murakami, P.F., Turner, M.R., van den Berg, A.K., & Schaber, P. G. (2005). An Instructional Guide for Leaf Color Analysis using Digital Imaging Software. Retrieved from https://www.nrs.fs.fed.us/pubs/gtr/ne_gtr327.pdf
Raza Saeed, Salah. (2020). What is the difference between the absorption coefficient and the small (low) signal absorption coefficient?. Retrieved from: https://www.researchgate.net/post/What-is-the-difference-between-the-absorption-coefficient-and-the-small-low-signal-absorption-coefficient/5ecb75b13f6b820cf3376c84/citation/download.
Sapkota, A. (2021, June 28). Photosynthesis- Definition, Equation, Steps, Process, Diagram. Retrieved from https://thebiologynotes.com/photosynthesis/#types-stages-parts-of-photosynthesis
Ta, T. H., Shin, J. H., Ahn, T. I., & Son, J. E. (2011). Modeling of transpiration of paprika (Capsicum annuum L.) plants based on radiation and leaf area index in Soilless culture. Horticulture, Environment, and Biotechnology, 52(3), 265–269. https://doi.org/10.1007/s13580-011-0216-3
Ustin, S. L., & Jacquemoud, S. (2020). How the optical properties of leaves modify the absorption and scattering of energy and enhance leaf functionality. Remote Sensing of Plant Biodiversity, 349–384. https://doi.org/10.1007/978-3-030-33157-3_14
Zhang, L., Hu, Z., Fan, J. (2014). A meta-analysis of the canopy light extinction coefficient in terrestrial ecosystems. Front. Earth Sci. 8, 599–609. https://doi.org/10.1007/s11707-014-0446-7
Related Products
Most Popular Articles
- Transpiration in Plants: Its Importance and Applications
- Leaf Area – How & Why Measuring Leaf Area…
- How to Analyze Photosynthesis in Plants: Methods and Tools
- Plant Respiration: Its Importance and Applications
- The Forest Canopy: Structure, Roles & Measurement
- Stomatal Conductance: Functions, Measurement, and…
- Forest & Plant Canopy Analysis – Tools…
- Root Respiration: Importance and Applications
- 50 Best Universities for Plant Science
- The Importance of Leaf Area Index (LAI) in…