Seven Crucial Applications Of Leaf Area Data
Dr. Vijayalaxmi Kinhal
January 9, 2023 at 4:59 pm | Updated January 9, 2023 at 5:13 pm | 10 min read
- Leaf area data is essential to research as the leaf is the largest plant organ involved in several crucial physiological processes and has maximum environmental interaction.
- Leaf area directly correlates to photosynthetic capacity, transpiration rate, and stomatal conductance.
- Plant growth and biomass accumulation can be predicted using leaf area data. This relationship has applications in estimating crop yield and carbon sequestration.
- Leaf area data is used to measure abiotic and biotic stress and plant response to climate change since it is sensitive to the environment.
The leaf is the largest plant organ and one of the most vital for several crucial physiological processes. The plant part also has the most significant interface with the external atmosphere. Therefore, leaf traits are integral to physiological, ecological, and agronomical experiments.
The Leaf traits usually used are leaf area, longevity, chemical composition, and carbon allocation. Among these, leaf area is one of the most common plant traits measured as it provides information on several processes and is relatively easy to estimate.
The use of leaf area data is growing popular in research since newer methods allow non-destructive and cost-effective plant analysis. Moreover, leaf area can indicate many internal physiological processes, making this relatively simple parameter attractive.
Subscribe to receive our monthly round-up of articles.
This article focuses on seven crucial applications of leaf area data for plant research in the following sections.
1. Plant Photosynthesis Rate
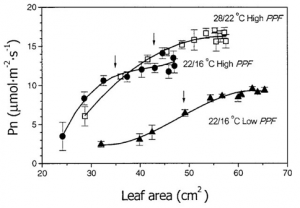
Figure 1. “Net photosynthetic rate (Pn) as a function of individual leaf area expansion, at selected day/night temperature and PPF regimes,” Funnell et al. (2002). (Image credits: https://doi.org/10.21273/jashs.127.2.290)
All green parts of a plant can conduct photosynthesis. However, plant photosynthetic capacity is measured in leaf photosynthetic rate, even though green stems can also perform photosynthesis and contribute up to 30 to 50% of carbon fixation in arid environments.
The leaf area is the common photosynthetic area since the leaf’s orientation is better suited for light interception. Also, the photosynthetic rate is higher in leaves than in vertical green stems, even when the latter has a larger surface area.
During photosynthesis, green leaves intercept light to combine carbon dioxide (CO2) taken in through stomata, and water molecules are absorbed and transported to leaves to produce chemical energy. Leaf area data is essential for estimating photosynthetic rate in many ways:
- The leaf area is directly connected to the surface available for light interception. Changes in leaf area and light absorbed will change photosynthetic rates.
- The number of stomata through which carbon dioxide is exchanged with the atmosphere also is directly correlated to leaf area. So more leaf area provides more CO2 for photosynthesis.
Each species has a different leaf shape and size. Still, depending on the health, nutrition, and environment, leaf area can vary within a species or cultivar to influence the photosynthetic rate. In addition, the sensitivity of leaf area to the atmosphere increases its utility in research to measure photosynthetic rate, as a reduction in leaf area will result in a fall in photosynthetic rate.
Until recently, research was focused on improving photosynthetic rates through genetic engineering. Nowadays, scientists try to increase leaf area to improve photosynthetic rate.
2. Measuring Transpiration Rate and Stomatal Conductance
Stomatal Conductance or opening regulates plant exchange of carbon, water, and oxygen with the environment. Stomata are openings on the ventral or lower side of the leaves and are directly correlated to the leaf area. Hence, leaf area data can monitor water loss, water use efficiency, respiration rate, and photosynthesis.
Loss of water vapor or transpiration is strongly connected with the photosynthetic rate. Transpiration demand increases due to higher temperatures, humidity, and wind. As transpiration increases, the water deficit in the leaves causes plants to absorb water from the soil. Hence transpiration is directly connected to crop water use efficiency. Different species and varieties will have differing transpiration rates.
Generally, there is little transpiration at the beginning of a crop due to less leaf area. As the crop grows and leaf area increases, transpiration also increases. When the crop is fully mature, transpiration can account for 90% of evapotranspiration. The same phenomena occur in natural ecosystems. Therefore reforestation has increased evapotranspiration in Europe. These are significant trends that scientists can follow using leaf area data from the field to regional scales using satellite imagery.
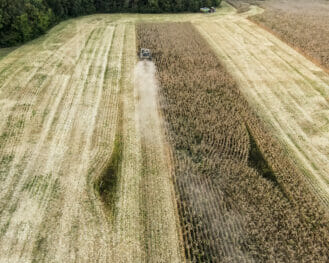
3. Plant Growth and Yield Indicator
Photosynthesis fixes carbon dioxide to produce carbohydrates that account for 90% of a plant’s biomass. Water use efficiency is also closely connected to growth and biomass accumulation. Therefore, leaf area influencing the two physiological processes is used to predict growth rate and yield.
Many studies are connecting photosynthetic rate to biomass accumulation in crops and natural ecosystems. For example, increasing leaf area will improve the photosynthetic rate, but it also increases transpiration, so leaf area should be optimized to get the most yield from a crop.
Leaves are also sinks and need biomass allocation to grow and maintain themselves. It is well known that orchards use thinning and pruning to reduce competition with developing fruits for carbon. Reducing leaf area can also increase light interception by fruits improving their quality. Therefore, leaf area data is an ideal indicator for studies on these subjects.
Yield is said to be a function of leaf area. Yield or biomass accumulation depends on several vegetative features like leaf area, leaf number, stems, and plant height. Leaf area is the easiest for scientists to monitor at various scales; therefore, it is used for plant growth and yield analysis. Greenness or leaf area is a standard parameter in precision farming software analytics to predict the yield of crops or biomass accumulation in precision forestry.
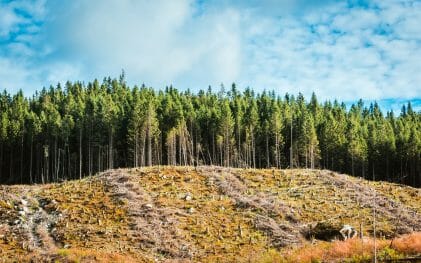
4. Estimating Carbon Sequestration and Fluxes
A direct application of the relationship of leaf area to biomass accumulation is in estimating carbon sequestration and tracing fluxes in natural ecosystems.
As the global efforts to contain climate change increase, studies on carbon sinks and changes are becoming more common. Other reasons driving the estimation of carbon sinks and sequestration are basic research, understanding ecosystem functioning, nutrient cycling, and formulating climate mitigation and adaptation projects.
Leaf area, which is sensitive to the environment, plant age, ecosystem type, season, and genotype, is a vital vegetation structure trait. Therefore, it is easier to quantify and study changes in leaf area to estimate carbon. In addition, the simplicity of leaf area analysis at various scales through varying methods makes it versatile for measuring carbon sequestration.
Therefore, leaf area and leaf area index, the one-sided leaf area per unit, is integrated into several standard models and methods of monitoring vegetation using remotely sensed data.
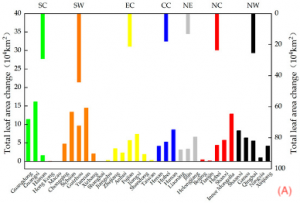
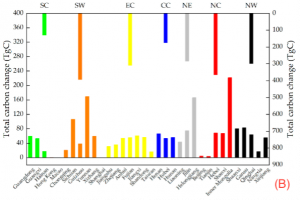
Figure 2: “Provincial-level (the primary axis) and regional-level (the secondary axis) net changes in the total leaf area from 2000 to 2018 in (A) and net changes in the total carbon sequestration from 2000 to 2018 in (B). The seven regions are southern China (SC), southwestern China (SW), eastern China (EC), central China (CC), northeastern China (NE), northern China (NC), and northwestern China (NW),” Hu, et al. 2022. (Image credits: https://doi.org/10.3390/f13101623)
Leaf areas estimated by remotely sensed imagery have been verified by field studies using portable tools on the field, speeding the application of this parameter in carbon estimation models. As a result, it has been possible to track net gains in carbon in several land use types ranging from cropland, grassland, and shrublands, to forests and savannas. For example, a study calculated the change in leaf area in each province in China to monitor carbon gains, see Figure 2.
5. Monitoring Response to Nutrients
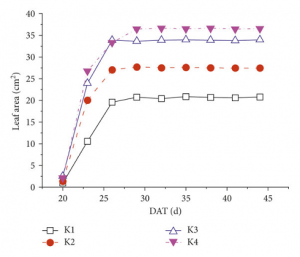
Figure 3: “Dynamic responses of leaf area to different nutrient supplies: (a) N treatment, (b) P treatment, (c) K treatment, and (d) the overall changes in the N, P, K, and normal treatments (average values of the four nutrition levels in each treatment). DAT: the day after transplantation,” Sun et al. 2018. (Image credits: https://doi.org/10.1155/2018/1469314).
Nitrogen stimulates leaf growth and expansion as it helps in cell division and is part of proteins and the cytoskeleton. Nitrogen is critical for forming leaves and their development, and to a lesser extent, phosphorus and potassium. For example, maize leaves show a 29% growth due to high nitrogen fertilization than plants with lower nitrogen supply.
Nitrogen is also needed for the photosynthesis apparatus. Nitrogen supply can hasten leaf senescence in maize, delay it in wheat, and total plant leaf area.
Nitrogen deficiency has the most effect on leaf growth compared to potassium or phosphorus deficiency. These three elements are also the macronutrients added to fertilizer. It is possible to measure plant response to fertilizer addition by monitoring leaf area in different stages of the crop cycle, as shown in Figure 3.
Leaf area response to different nutrients can improve diagnosis in research for crop breeding, optimizing agronomic practices, and evaluation of vegetative indices. In addition, not all genotypes of a crop species are equally responsive to nutrient addition, so differences in leaf area are an easy way to estimate plant response to choose suitable varieties for a given soil or fertilization program.
6. To Measure Abiotic and Biotic Stress
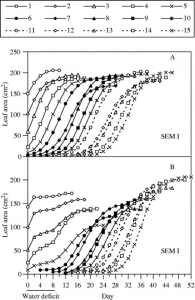
Figure 4: “Time courses of expansion of leaves of control (A) and water-stressed (B) plants during an 8-d period of water deficit, and after rewatering. Leaves numbered 1–15 (from base to apex of plants) are shown,” Alves, A. C., & Setter, T. L. (2004). (Image credits: https://doi.org/10.1093/aob/mch179)
Leaf growth and development are affected by both abiotic and biotic stress. Therefore, leaf area data can act as an indicator of stress.
The typical stress affecting the leaf area is water deficiency. Leaf growth can be stopped when the plant suffers from water deficiency, as water is needed for cell expansion. Even cell division in the initial stages of leaf development can halt. As a result, there can be a delay in the recovery of leaf growth after rewatering, leading to reduced leaf area. The drought effects thus extend to later plant stages. As a drought tolerance response, the plant arrests leaf expansion to save resources to tide over brief spells of water deficiency to help it recover after rewatering. Genotype has a significant role in determining plant response to water stress.
Quantifying herbivory effects through leaf area is widely used in basic and applied science to understand plant-herbivore interactions.
Herbivory is seriously affecting crops and forest trees. Biotic stresses changing leaf areas are commonly herbivory by insects and grazing animals. Leaf area reduction due to insect herbivory can reduce forest net primary productivity by 20%.
In tender annual crops, the effect can be more serious. The loss in leaf area through cutting, mining of lamina, etc., can reduce physiological processes like photosynthesis, transpiration, and stomatal conductance affecting crop yield. Crop growth models use leaf area reductions due to pests and diseases in various models to predict yield.
7. Climate Change Response:
Climate change effects can be vital in natural ecosystems and rainfed croplands where supplementary watering is unavailable to mitigate drought.
The leaf area is sensitive and varies with climate change. In addition, the leaf area is susceptible to environmental changes because it has the most significant plant surface area exposed to the atmosphere. Therefore, leaf area is used to study the effects of various climate factors like carbon dioxide levels, temperature, radiation, and drought.
Higher levels of CO2 and temperature can increase leaf area but not higher radiation. Drier years also have been shown to reduce leaf area.
Leaf area data has already been successfully used to demonstrate climate change effects on vegetation. Studies have shown that climate change can shift plant morphology over time. In Australia, a study using herbarium specimens and field data showed that leaf area had been reduced in a species over 127 years, in Dodonaea viscosa, due to a change in the minimum temperature. Phenotypic plasticity that allows plants of the same species to adapt to local conditions in space and time is driving this change in leaf area.
Earth system models predict that leaf area will increase globally due to higher atmospheric carbon dioxide, land cover change, and climate change based on satellite imagery over three decades.
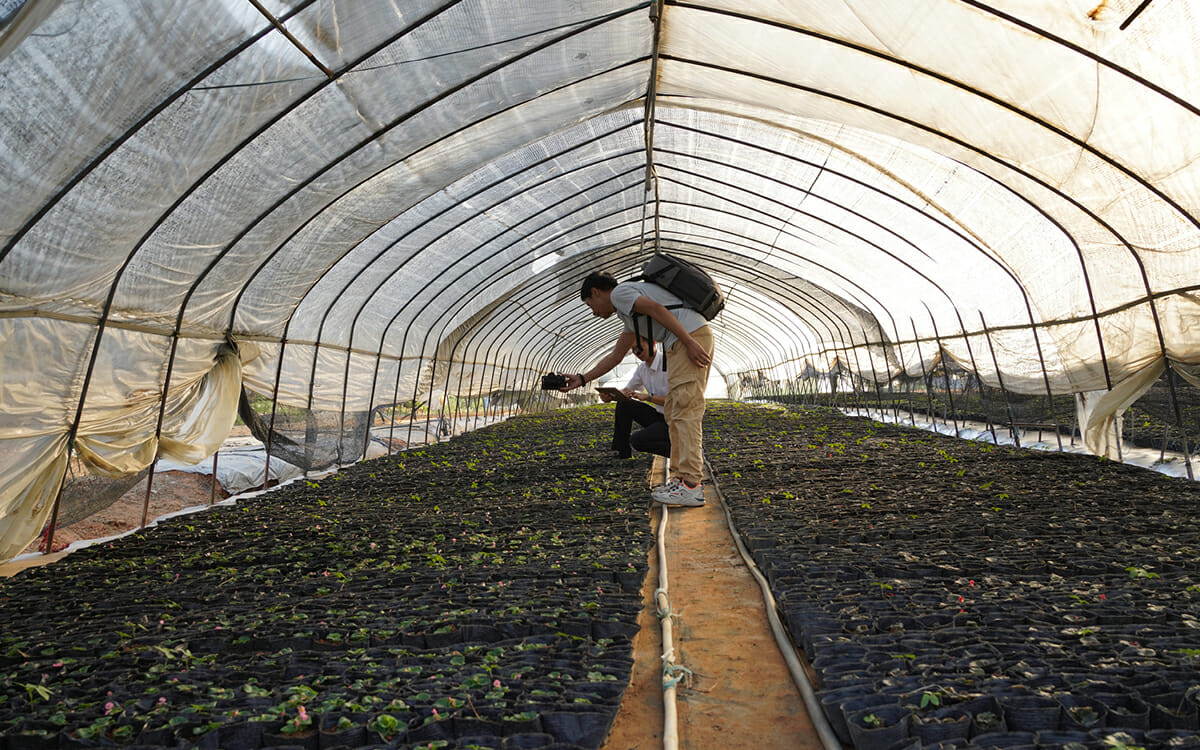
Measuring Leaf Area
Modern non-destructive techniques replace traditional gravimetric methods, square grid meters, and area-length regressions. Nowadays, digital scanners and cameras, combined with image processing software, give leaf area measurements in real-time. These measurements are also accurate and can be conducted onsite in the field. The CID Bio-Science’s CI-202 Portable Laser Leaf Area Meter and CI-203 Handheld Laser Leaf Area Meter are standard devices available for plant research that scientists have used for many years. These new devices make research easier for scientists and allow for temporal studies.
Sources
Alkama, R., Forzieri, G., Duveiller, G., Grassi, G., Liang, S., & Cescatti, A. (2022). Vegetation-based climate mitigation in a warmer and Greener World. Nature Communications, 13(1). https://doi.org/10.1038/s41467-022-28305-9
Alves, A. C., & Setter, T. L. (2004). Response of Cassava Leaf Area Expansion to Water Deficit: Cell Proliferation, Cell Expansion and Delayed Development. Annals of Botany, 94(4), 605-613. https://doi.org/10.1093/aob/mch179
Bassi, D., Menossi, M., & Mattiello, L. (2018). Nitrogen supply influences photosynthesis establishment along the sugarcane leaf. Scientific Reports, 8.
Battie-Laclau, P., Laclau, JP., Piccolo, M.d.C., et al. (2013). Influence of potassium and sodium nutrition on leaf area components in Eucalyptus grandis trees. Plant Soil 371, 19–35. https://doi.org/10.1007/s11104-013-1663-7
Easlon, H. M., & Bloom, A. J. (2014). Easy Leaf area: Automated Digital Image Analysis for rapid and accurate measurement of Leaf Area. Applications in Plant Sciences, 2(7), 1400033. https://doi.org/10.3732/apps.1400033
FAO. (n.d.). Chapter 1 – Introduction to Evapotranspiration. Retrieved from https://www.fao.org/3/x0490e/x0490e04.htm
Funnell, K. A., Hewett, E. W., Plummer, J. A., & Warrington, I. J. (2002). Acclimation of photosynthetic activity of Zantedeschia `Best Gold’ in response to temperature and photosynthetic photon flux. Journal of the American Society for Horticultural Science, 127(2), 290–296. https://doi.org/10.21273/jashs.127.2.290
Guerin, G. R., Wen, H., and Lowe, A. J. (2012). Leaf morphology shift linked to climate change. Biol. Lett.8882–886. http://doi.org/10.1098/rsbl.2012.0458
Hoek van Dijke, A. J., Mallick, K., Schlerf, M., Machwitz, M., Herold, M., & Teuling, A. J. (2020). Examining the link between vegetation leaf area and land-atmosphere exchange of water, energy, and carbon fluxes using FLUXNET Data. Biogeosciences, 17(17), 4443–4457. https://doi.org/10.5194/bg-17-4443-2020
Hu, Q., Gong, E., Wang, Z., Zhang, J., Liu, W., & Feng, F. (2022). Spatiotemporal changes in leaf area and carbon sequestration of terrestrial vegetation in China over the last two decades. Forests, 13(10), 1623. https://doi.org/10.3390/f13101623
Lü, C., Ren, H., Zhang, Y., and Shen, Y. (2010). Leaf Area Measurement Based on Image Processing,” 2010 International Conference on Measuring Technology and Mechatronics Automation, 580-582, DOI: 10.1109/ICMTMA.2010.141.
Schrader, J., Pillar, G., & Kreft, H. (2017). Leaf-it: An Android application for measuring leaf area. Ecology and Evolution, 7(22), 9731–9738. https://doi.org/10.1002/ece3.3485
Sun, Y., Gao, J., Wang, K., Shen, Z., & Chen, L. (2018). Utilization of machine vision to monitor the dynamic responses of rice leaf morphology and colour to nitrogen, phosphorus, and potassium deficiencies. Journal of Spectroscopy, 2018, 1–13. https://doi.org/10.1155/2018/1469314
Vazquez-Cruz, M. A., Luna-Rubio, R., Contreras-Medina, L. M., Torres-Pacheco, I., & Guevara-Gonzalez, R. G. (2012). Estimating the response of tomato (Solanum lycopersicum) leaf area to changes in climate and salicylic acid applications by means of artificial neural networks. Biosystems Engineering, 112(4), 319–327. https://doi.org/10.1016/j.biosystemseng.2012.05.003
Wang, X.-F., Liu, J.-F., Gao, W.-Q., Deng, Y.-P., Ni, Y.-Y., Xiao, Y.-H., Kang, F.-F., Wang, Q., Lei, J.-P., & Jiang, Z.-P. (2016). Defense pattern of Chinese cork oak across latitudinal gradients: Influences of ontogeny, herbivory, climate and soil nutrients. Scientific Reports, 6(1). https://doi.org/10.1038/srep27269
Related Products
Most Popular Articles
- Transpiration in Plants: Its Importance and Applications
- Leaf Area – How & Why Measuring Leaf Area…
- How to Analyze Photosynthesis in Plants: Methods and Tools
- Plant Respiration: Its Importance and Applications
- The Forest Canopy: Structure, Roles & Measurement
- Stomatal Conductance: Functions, Measurement, and…
- Forest & Plant Canopy Analysis – Tools…
- Root Respiration: Importance and Applications
- 50 Best Universities for Plant Science
- The Importance of Leaf Area Index (LAI) in…