LAI Modeling to Improve Kiwifruit Orchard Management
Michael Williams
March 16, 2022 at 5:50 am | Updated April 28, 2022 at 9:47 pm | 6 min read
This recent study combines many firsts to guide the management of kiwifruit orchards through precision agriculture. By focusing on leaf area index, choosing a precise estimation tool, the CI-110 Plant Canopy Imager, and including important textural information, the scientists aimed to discover and improve model prediction for monitoring growth and yield estimation in kiwifruit orchards. Find out more about their new approach and why it is helpful for future modeling.
A Novel Kiwifruit Study
Ordinarily, UAV or drone-based remote sensing in precision agriculture for food crops uses estimations of chlorophyll content, nitrogen content, and biomass accumulation. Leaf Area Index (LAI) is rarely used, especially for orchards. However, real-time LAI is a proven diagnostic parameter for crop growth, yield, and management regulation.
LAI is the one-sided leaf area per unit area of land. Since leaves indicate the total area for photosynthesis in most crops, LAI is an effective parameter of vegetative growth and health, physiological processes, and ecosystem functioning.
Subscribe to receive our monthly round-up of articles.
Direct estimations of LAI are destructive, time-consuming, and often require trained personnel to execute. By using drone imagery to estimate LAI, researchers can circumvent this problem. However, scientists do need to make field estimations of LAI to calibrate and validate models, which can be used to analyze drone imagery.
To get the necessary field LAI estimations, the Natural Resource scientists, Zhang, Ta, Guo, Chen, Zhao, Li, and Chang, chose to use image analysis-based instruments to calculate LAI instead of radiometric tools. They chose this method over its radiometric counterpart because the latter is limited by weather conditions and is suitable for only sunny days. Hemispherical photography tools like the chosen CI-110 Plant Canopy Imager, manufactured by CID Bio-Science Inc., can be used in virtually any weather conditions.
Moreover, the scientists posit that the image measurements are more accurate than radiometric measurements and more suitable for the unique planting pattern and canopy of kiwifruit trees. To calculate LAI, the CI-110 measures sun flecks of photosynthetically active radiation (PAR) and the sky visible through the canopy, average foliage inclination angles, and plant canopy extinction coefficients.
Prior to this study, there had been no LAI estimations of kiwifruit orchards using the more precise LAI measurements by CI-110 aimed at guiding kiwifruit breeding and management.
Thirdly, though texture has been used for image classification to identify crops and forests, its use in imagery analysis of orchards is rare. So, the scientists wanted to estimate LAI using information from color or spectral information and texture from images.
Collecting Canopy Data
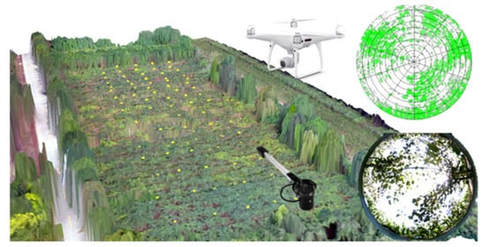
Figure 1: “Three-dimensional visualization of sampling sites in the kiwifruit orchard and equipment” – drones and the Plant Canopy Imager CI-110 and the images from the hemispherical lens, Zhang et al. 2022. (Image credits: https://doi.org/10.3390/rs14051063)
The study site was a kiwifruit orchard in the temperate and semiarid region of Shaanxi Province, China.
The scientists sampled 80 trees in initial flowering, young fruit, and fruit enlargement stages.
Half a meter above the ground and below the tree canopies, two observations were made in each sampling point, shown as yellow dots in Figure 1, using the Plant Canopy Imager. The 0.84 meters long probe has sensors to measure the sun flecks, and the camera at the end has a high-resolution 150° fisheye lens. The LAI is calculated by the software using preloaded formulae.
The drone imagery was also taken at the three stages-flowering, young fruiting, and late fruiting. The scientists calculated the average digital number of the region of interest. They then selected the average DN value, normalized DN values, and spectral indices for the three color bands: red, green, and blue.
RGB images were used to calculate seventeen vegetative indices (e.g., Modified Green Red Vegetation Index- MGRVI) and six spectral parameters (e.g., r- Normalized Redness Intensity). Twenty-four textural parameters were derived for each of the three colors – mean, variance, homogeneity, contrast, dissimilarity, entropy, angular second moment, and correlation.
Building Predictive LAI Models
The researchers built two chemometric models, four kinds of univariate regression models, and two multivariate models that integrated machine learning functions like stepwise regression (SWR) and random forest regression (RFR).
About 80% of the data was used for model training, and 20% were set aside for validation to evaluate the prediction of the LAI estimation models.
Higher values of coefficient of determination (R2) with lower values of both root mean square error (RMSE) and normalized root mean square error (nRMSE) established the accuracy of the LAI estimation models.
Selecting a Multivariate LAI Model
The scientists found that the LAI of each crop growth stage was correlated with separate combinations of spectral indices and textural information obtained from the RGB images.
● Twenty-six parameters- ten spectral and 16 texture features- were correlated with the flowering stage.
● Thirty-five parameters- 15 spectral and 20 texture features- were correlated with the two fruiting stages.
The univariate models used five single factors, which had the highest correlation with each stage. However, when validated, these models showed that the predicted values were below actual low LAI values and overshot higher field LAI values. Due to these inaccuracies, the scientists rejected the univariate models for LAI prediction.
Multivariate Models
When only spectral data was considered, SWR models needed nine parameters for the young fruiting stage, six parameters for the fruit enlargement stage, and three parameters for the flowering stage. These models were better than univariate models. The modeling R2 was between 0.541 to 0.819, RMSE was 0.049 to0.102, and nRMSE was 11.55 to16.81%. The verification R2 was between 0.690–0.819, RMSE was 0.057 to 0.084, and nRMSE was 13.10 to16.36%.
The RFR models performed the best in predicting LAI at all stages than SWR, with R2 between 0.965 to 0.973, when only spectral values were used. The young fruit models were the most accurate.
When textural features were added, SWR needed 27 variables for your fruit stage, 21 features for the fruit enlargement stage, and 18 variables for the flowering stage. Adding textural data improved the multivariate models’ prediction for all growth stages. Flowering stage models especially experienced a significant improvement in prediction accuracy, with R2 increasing from 0.318 to 0.859.
Similarly, RFR prediction accuracy for LAI improved when texture features were added to the models so that the R2 was over 0.968 for all models. The fruit enlargement models performed the best. Overall, RFR models had higher prediction accuracy for all three growth stages than SWR models, see Figure 2.
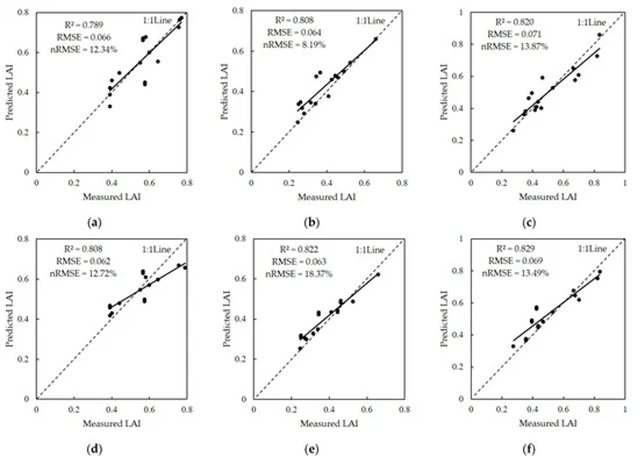
Figure 2: “Validation results of combined texture feature models with SWR and RFR in each growth stage. (a) With SWR model in initial flowering stage (IF); (b) with SWR model in young fruit stage (YF); (c) with SWR model in fruit enlargement stage (FE); (d) with RFR model in initial flowering stage (IF); (e) with RFR model in young fruit stage (YF); (f) with RFR model in fruit enlargement stage (FE),” Zhang et al. 2022. (Image credits: https://doi.org/10.3390/rs14051063)
The RFR model built with spectral and textural features was thus the best at predicting LAI for all three crop stages. So they were used for inversion mapping and graded. The maps show that there are fewer leaves as flowering begins, so the LAI is less than 0.6. In the next young fruit stage, the leaves have grown larger due to rains, and the LAI is between 0 and 3.2. In the third phase at the fruit enlargement, leaves were also abundant in most places, so the LAI reached 4.0, see Figure 3.
So the scientists have proved that adding texture features is a viable option to improve model accuracy for orchard crops. Most models for imagery analysis currently focus only on spectral data from images and the derived vegetative indices and are missing out on valuable information from texture that can improve predictions.
For future studies, the scientists recommend refining the models with data sourced from orchards in varying regions and years to make a more general and robust model.
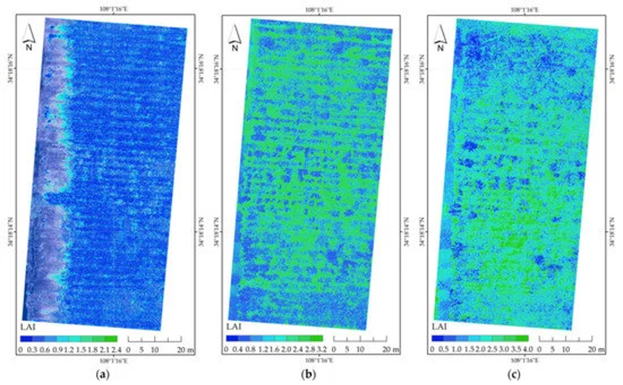
Figure 3. Inversion mapping showing the “spatial distribution of kiwifruit LAI estimation in the study area. (a) Initial flowering stage (IF); (b) young fruit stage (YF); (c) fruit enlargement stage (FE),” Zhang et al. 2022. (Image credits: https://doi.org/10.3390/rs14051063)
A New Theoretical Basis
With this experiment, the scientists showed that it is possible to non-destructively measure LAI at large scale, and do so at a lower cost than traditional field methods that are destructive and tedious. Moreover, the three bands of RGB also provide a simpler alternative to complex hyperspectral images with redundant data. With state-of-the-art image analysis in a user-friendly package, monitoring kiwifruit crops is easier and more efficient than ever before.
—
Vijayalaxmi Kinhal
Science Writer, CID Bio-Science
Ph.D. Ecology and Environmental Science, B.Sc Agriculture
Read the detailed study published in the original peer-reviewed paper:
Zhang, Y., Ta, N., Guo, S., Chen, Q., Zhao, L., Li, F., and Chang, Q. (2022). Combining Spectral and Textural Information from UAV RGB Images for Leaf Area Index Monitoring in Kiwifruit Orchard. Remote Sens., 14(5), 1063; https://doi.org/10.3390/rs14051063
Related Products
Most Popular Articles
- Transpiration in Plants: Its Importance and Applications
- Leaf Area – How & Why Measuring Leaf Area…
- How to Analyze Photosynthesis in Plants: Methods and Tools
- Plant Respiration: Its Importance and Applications
- The Forest Canopy: Structure, Roles & Measurement
- Stomatal Conductance: Functions, Measurement, and…
- Forest & Plant Canopy Analysis – Tools…
- Root Respiration: Importance and Applications
- 50 Best Universities for Plant Science
- The Importance of Leaf Area Index (LAI) in…