Hemispherical Photography to Estimate Leaf Area Index in Cotton
Scott Trimble
January 22, 2021 at 8:44 pm | Updated March 15, 2022 at 11:40 am | 5 min read
Non-destructive hemispherical photography provides a rapid and efficient means of collecting information on several eco-physiological features of plants. Scientists are eager to expand the use of this method to estimate the Leaf Area Index in annual crops. Testing the technique provides answers, but it also raises fresh challenges. A reliable standard tool, such as the CI-110 Plant Canopy Imager, which decreases the number of variables scientists have to contend with, is a welcome addition to their toolbox.
Importance of Leaf Area Index
Leaf Area Index (LAI) is the total (one-sided) leaf area per unit of ground area. In other words, to measure LAI, researchers must consider the area of all leaves and its ratio to ground area.
The Leaf Area Index formula is LAI = Leaf area (m2)/Ground cover (m2).
Subscribe to receive our monthly round-up of articles.
The Leaf Area Index of plants will differ spatially and temporally, depending on the type of vegetation, season, and growth stage.
The architecture of plants, leaf shape, and size also influence Leaf Area Index.
Leaf Area Index has become an important ecophysiological indicator in plant science for many reasons. Leaves are the main organ of the interface of plants with the atmosphere, where an exchange of carbon dioxide, oxygen, and water vapor occurs. Leaves are also influenced by the internal physiology of plants, such as photosynthesis or stress, and availability of nutrition.
Leaf Area Index is, therefore, used as an indicator of plant growth, primary productivity, photosynthetic efficiency, and biomass accumulation.
Over time, many methods have been developed to estimate Leaf Area Index. Some are direct and some are indirect.
It can be challenging to estimate canopy for Leaf Area Index in large crop fields. Direct methods can be destructive, time-consuming, and laborious, yet they can still not provide enough data points to give a meaningful picture of the crop. Indirect methods rely on plant canopy analyzers that are either ground-based or use remote estimation. These indirect methods are non-destructive and reliable.
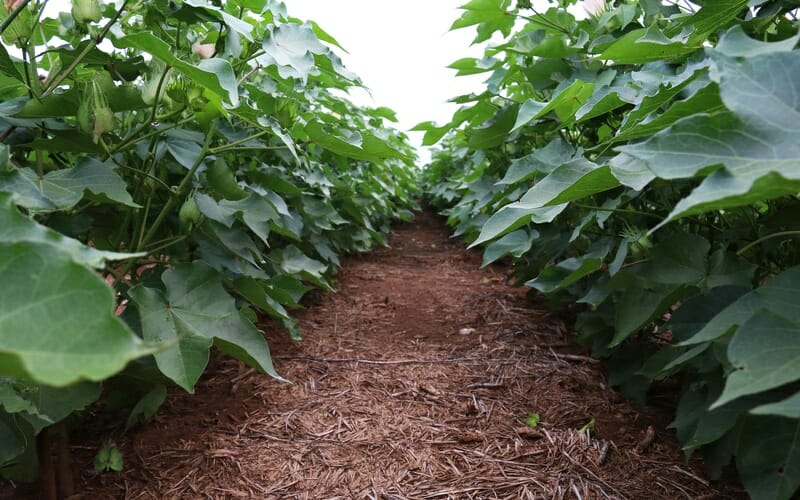
Brandão and Zonta, two Brazilian scientists, wanted to compare check the suitability of non-destructive methods of plant canopy analysis for estimating Leaf Area Index in cotton. They included the standard destructive method as a reference for comparison.
To collect data from a wide range of cotton plants showing different biomass, leaf area, and yield, they used four treatments of nitrogen (0, 90, 180, and 270 kg ha-1) and phosphorus (0, 120, 240, and 360 kg ha-1). All other supplementary nutrients and irrigation regimes were similar. A split-plot experiment with four replicates was used.
Plant height, number of leaves, leaf midrib, biomass, and yield were also recorded for each of the ten plants selected.
Challenge: Finding Non-destructive methods for Leaf Area Index Estimation
The scientists had to find a non-destructive canopy analyzer appropriate for the short-statured cotton crops. Indirect plant canopy analyzers measure light being transmitted through the canopy or reflected by the foliage. The solutions available are suitable for different situations and each have their own advantages and disadvantages.
Radiation reflectance methods measure the solar radiation reflected by foliage. Healthy plants have a spectrum that shows a higher level of near-infrared than red light. The opposite is true for stressed plants. Spectrometers record the spectrum that is later analyzed by vegetative indices. Handheld and remote sensed imagery can measure radiation reflectance.
However, the vegetative indices are only proxies and do not give absolute Leaf Area Index, which the scientists needed, so this method alone was not enough.
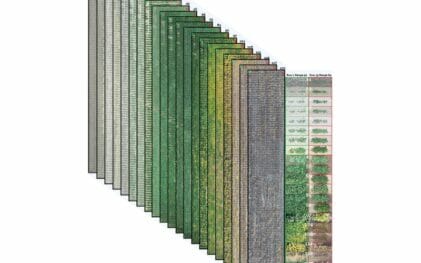
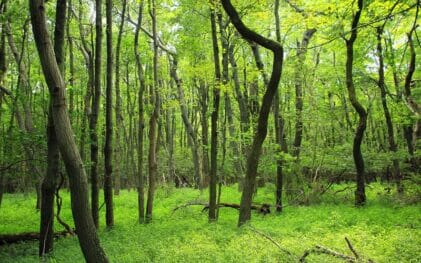
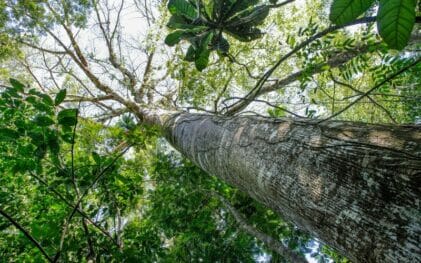
Hemispherical canopy photography involves taking photographs of the canopy from underneath and analyzing the images with software for non-destructive estimation of Leaf Area Index. Scientists have successfully tried the device in plantations and forests to calculate LAI and biomass. However, the use of this plant canopy analyzer for annual crops is just beginning.
Solution: CI-110 Plant Canopy Imager
Brandão and Zonta decided to test hemispherical canopy photography for cotton plants along with a second method.
They selected the CI-110 Plant Canopy Imager produced by CID Bio-Science Inc., for hemispherical photography. For the second non-destructive method, they calculated the leaf area based on the length of the midrib of the leaf.
Data were collected on two days, 60 and 75 DAE (Days After Emergence), to represent two phenological stages of cotton plants: vegetative and bolling.
The scientists used the CI-110 about 3 cm above the ground early in the morning under partially cloudy skies
This particular plant canopy analyzer has an auto-leveling camera lens of 150° that displays the image, allowing users to choose one that meets their requirements. Then, the tool automatically analyzes the fisheye images of the canopy with proprietary software to give LAI for each photo. Twenty-four sensors on the long handle simultaneously record photosynthetically active radiation (PAR) of sun flecks, providing information about the environment.
Hemispherical photography uses the position, size, and distribution of canopy gaps in combination with the zenith angle to estimate transmission of solar radiation.
The device also uses the Gap Fraction Method for analysis, where users can divide the photos of their choice into sectors based on the number of zenith and azimuthal divisions. A value of “0” is assigned to images with no visible sky, and this can vary up to “1” where the entire photo shows the sky.

Benefits of the CI-110 Plant Canopy Imager
The CI-110, which has since been updated to be both more robust and ergonomic, was light and easy to carry and handle in the field.
The scientists found the images taken to be of high resolution and very helpful in the estimation of Leaf Area Index.
Getting Leaf Area Index calculations automatically for each image in real-time saved the scientists a lot of work and time in data analysis.
The scientists also got information on the spatial and temporal variations of light below the surface. This gave them insights into the microclimatic conditions that affect plant growth.
The scientists found the CI-110 was well adapted for low-lying canopies, making it ideal for use for annual crops. Moreover, no above canopy measurement is necessary.
The internal compass and GPS allowed scientists to collect data from the same spot on the 60th and 75th DAE.
Leaf Area Index Estimation by Hemispherical Photography is Appropriate for Cotton Plants
Hemispherical photography was the best of the two non-destructive methods. It showed a Pearson’s correlation coefficient equal to 0.785 with the standard destructive method.
However, hemispherical photography underestimated the Leaf Area Index by 15% and 30% on the 60th and 75th DAE, respectively. This was most likely due to the grouping of leaves, flowers, and fruits around the stems, allowing more light transmittance.
Further studies will be necessary to correct these deviations caused by the unique clumping pattern of leaves seen in cotton plants to get an accurate estimate of Leaf Area Index.
Instrument calibration is one way of getting around this problem. Also, scientists suggest varying the time of data.
The biomass showed a close correlation of 80% with Leaf Area Index in both destructive and non-destructive methods.
Even though yield showed only a low correlation with Leaf Area Index measurements made by hemispherical photography, it was better than the prediction made by destructive methods, which were not correlated at all with yield.
Therefore, scientists could confidently recommend non-destructive hemispherical photography.
More Research is Needed
The Brazilian study was important in proving that hemispherical photography is a good alternative to slow and destructive methods of Leaf Area Index estimation in crops. However, more research is needed to fine-tune the algorithms used for these annual crops in calculating LAI and to ensure precise prediction of yield.
Vijayalaxmi Kinhal
Science Writer, CID Bio-Science
Ph.D. Ecology and Environmental Science, B.Sc Agriculture
Feature image courtesy of Alabama Extension
Source
Brandão, Ziany N., & Zonta, João H. (2016). Hemispherical photography to estimate biophysical variables of cotton. Revista Brasileira de Engenharia Agrícola e Ambiental, 20(9), 789-794. https://doi.org/10.1590/1807-1929/agriambi.v20n9p789-794
Nathalie J. J. Bréda, Ground‐based measurements of leaf area index: a review of methods, instruments and current controversies, Journal of Experimental Botany, Volume 54, Issue 392, 1 November 2003, Pages 2403–2417, https://doi.org/10.1093/jxb/erg263
Pokovai, K., & Fodor, N. (2019). Adjusting Ceptometer Data to Improve Leaf Area Index Measurements. Agronomy, 9(12), 866. doi:10.3390/agronomy9120866
Sanket, M. (2018). Re: What is the formula to find Leaf Area Index in Wheat?. Retrieved from: https://www.researchgate.net/post/What_is_the_formula_to_find_Leaf_Area_Index_in_Wheat/5ad58b18404854688f688328/citation/download.
Related Products
Most Popular Articles
- Transpiration in Plants: Its Importance and Applications
- Leaf Area – How & Why Measuring Leaf Area…
- How to Analyze Photosynthesis in Plants: Methods and Tools
- Plant Respiration: Its Importance and Applications
- The Forest Canopy: Structure, Roles & Measurement
- Stomatal Conductance: Functions, Measurement, and…
- Forest & Plant Canopy Analysis – Tools…
- Root Respiration: Importance and Applications
- 50 Best Universities for Plant Science
- The Importance of Leaf Area Index (LAI) in…