Improving Carbon Flux Modeling with Plant Canopy Analysis and Gas Exchange Measurement
Scott Trimble
June 2, 2021 at 9:20 am | Updated March 14, 2022 at 1:29 pm | 7 min read
Gross Primary Productivity models are crucial to estimate carbon flux in time and space. Integrating sun-induced chlorophyll fluorescence (SIF), which is sensitive to photosynthetic activity, can improve productivity estimates. However, scaling SIF from plants to landscape, while including a myriad of factors that influence how much incident solar light is used, is not easy. Therefore, to avoid “reinventing the wheel,” existing models are fine-tuned to improve estimation of forest productivity.
Carbon Flux Measurement
Terrestrial ecosystems can fix around 25% of the carbon emissions produced by people. Forests are the main habitats involved in carbon sequestration. Trees fix atmospheric carbon to maintain themselves and grow. Trees also continuously produce leaf and twig litter that decompose and add humus to the forest floor, building up the soil carbon banks. Thus, carbon flux, or movement of carbon, determines the carbon sequestration capacity of any ecosystem.
The total amount of carbon fixed by trees through photosynthesis is measured by the Gross Primary Productivity (GPP). However, photosynthetic rate is usually measured at the leaf scale. Extrapolating to landscape scale is not easy. Hence, GPP has been estimated thus far by biomass measurements through forest inventories.
Light Use Efficiency
One of the new methods of estimating GPP at larger scales is by using remotely sensed data. Many models have been created based on vegetation, light use efficiency, or process-based indices.
Subscribe to receive our monthly round-up of articles.
The light use efficiency (LUE) models have been used for over four decades. The LUE models operate on the assumption that GPP is related to the absorbed photosynthetically active radiation (APAR) and the rate at which CO2 is fixed per photon of absorbed light. All the solar light that falls on trees or individual leaves is not used in photosynthesis. Some bands of light not absorbed by chlorophyll are reflected off of the leaf surface. Hence, APAR is calculated as the product of incoming solar PAR and the fraction of photosynthetically active radiation (fAPAR) that is used in photosynthesis.
The fAPAR varies based on the environment and plant features. There are field devices to estimate leaf scale fAPAR. For large-scale estimations, fAPAR can be calculated as a function of Leaf Area Index (LAI).
fAPAR can also be calculated based on sun-induced fluorescence (SIF) of far-red light, a product of PAR and the chlorophyll content in leaves. Chlorophyll molecules absorb light photons and pass them on to photosystems one and two (PSI and PSII). The excess of photons not used in the photochemistry is released from the chloroplasts as heat or fluorescence. Chlorophyll fluorescence is widely used to measure photosynthetic rates, since fluorescence is high when there is less photosynthesis and vice versa. A direct link between SIF and GPP has been established and is known to be more sensitive than estimating GPP through vegetative indices (VIs).
SIF measurements are possible through some satellites directly. Alternatively, they can be estimated from known parameters.
Using the Modified Light Use Efficiency Model
Radiative Transfer (RT) models are used to simulate SIF from canopy. The SCOPE—Soil, Canopy Observation, Photochemistry, and Energy fluxes—is one such model. The advantage that the SCOPE model offers is that it can estimate SIF and photosynthetic rate using site-specific vegetation information.
SCOPE integrates vegetation and atmospheric parameters to simulate energy flux by combining two smaller models: the Soil-Vegetation-Atmosphere Transfer (SVAT) and Scattering by Arbitrary Inclined Leaves (SAIL).
The SCOPE has also been combined with other models to bring more features together. ARTMO (Automated Radiative Transfer Models Operator) combines SCOPE with PROSAIL. The PROSAIL model is a combination of canopy-based SAIL and leaf-based PROSPECT models. The PROSAIL model simulates top-of-canopy reflectance as a function of biophysical features (LAI, canopy height) and biochemical parameters (chlorophyll content, leaf water content, and dry matter).
ARTMO can estimate the spatial distribution of canopy chlorophyll content (CCC) and SIF, making use of the component models. Using known empirical relationships of CCC and SIF at tree scale makes it possible to scale the SIF to larger landscape scales
Forest and ecology scientists, Sinha, Padalia, Patel, and Chauhan, decided to use LUEf, an LUE model that integrated SIF and potential yield of fluorescence (ФF). SIF gives the amount of energy that falls on foliage, and fluorescence gives the SIF for each absorbed photon of light. The ecological scientists used SIF simulated by ARTMO model and ФF measured by a Pulse-Amplitude Modulated (PAM) fluorometer.
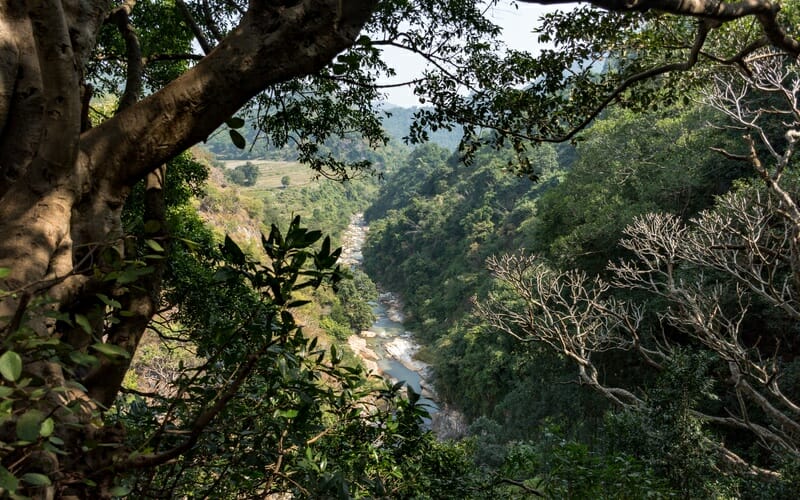
They used the model to study carbon flux in the tropical deciduous forests in the North-Western Himalayas, which account for about 13% of the total forests in India.
Combining Satellite and Field Data

To estimate the GPP of the mixed deciduous forest, the ecological scientists used six steps:
- Collect and analyze site-specific meteorological data and in situ field data of biochemical and biophysical parameters of forests
- Derive VIs and fAPAR variables by processing satellite data
- Simulate CCC and SIF using PROSAIL and SCOPE radiative transfer model
- Create the fLUE model for GPP estimation
- Create a temporal SIF map
- Validate the proposed SIF-based LUEf model of GPP predictions
Figure 1 shows the approach the scientists took to collect and analyze data and use the information to create the new fLUE model.
The scientists randomly chose 31 plots of 30 m x 30 m in the deciduous forests. In each of the large plots, they sampled three smaller 5 m x 5 m subplots. Satellite, as well as field data, was collected for each of these secondary small plots. The field data were collected either a week before or after the Sentinel-2 satellite passed over the study area.
To get LAI, hemispherical photographs and PAR measurements were taken from the ground level using the CI-110 Plant Canopy Imager, manufactured by CID Bio-Science Inc. CCI was measured with a chlorophyll meter from the top, middle, and bottom canopy leaves. Then, CCI and LAI were used to estimate CCC. Chlorophyll fluorescence, measured by a PAM fluorometer, was used to calculate the quantum yield of fluorescence (ФF). Figure 2 shows the position that measurements were made in the canopy by the three devices.
The scientists also collected meteorological data from the eddy covariance (EC) flux station on the study site. Meteorological data included the concentrations of CO2, H2O, solar radiation, soil and air temperature, relative humidity, and vapor density. These data were used to, again, calculate LAI and CCC using the PROSAIL and SCOPE models.

Satellite images were taken of the deciduous forests during leaf growth, peak leafy period, and senescence. Several vegetative indices (VIs), such as Normalized Difference Vegetation Index (NDVI), Soil Adjusted Vegetation Index (SAVI), Modified Chlorophyll Absorption Ratio Index (MCARI), and Enhanced Vegetation Index (EVI), were calculated based on satellite data of the forest canopy.
The VIs and PROSAIL derivatives were then used to calculate the fAPAR. This satellite-based fAPAR was corrected by in situ measurements of PAR above and below the canopy. The end results of the umbrella of ARTMO models were the canopy level SIF and CCC.
The canopy level SIF and CCC were used to develop regression equations to produce spatial maps of SIF at various wavelengths. These were SIF-740, SIF-760, and also, at the top of the canopy, SIF-TOC, for three seasons, as shown in Figure 3.
The current LUEf (GPP-SIF) model was created for GPP estimation, using the SIF spatial maps and ФF. The GPP from LUEf models were compared with the following:
- GPP calculated by using meteorological data from eddy flux (GPP-EDDY), which calculate CO2 flux between vegetation and atmosphere,
- GPP from LUE without SIF (GPP-LUE), and
- GPP from Moderate Resolution Imaging Spectroradiometer (MODIS-GPP).
LUE was estimated using EC tower data and photosynthetic rate measurements by the CI-340 Handheld Photosynthesis System, manufactured by CID BioScience Inc. This was used in the LUE model for GPP-LUE calculations.

Improved and Sensitive GPP Model
This is one of the rare studies that use SIF for direct forest GPP estimation. The new modified LUEf model was successful in estimating GPP.
The ecological scientists found that absorbed PAR (APAR) varied from 0.4 to 14% due to season. APAR measured in October had the least spatial variation because there is maximum foliage. The near-continuous canopy cover eliminates background reflectance from bare soil. In general, fAPAR showed a good correlation with simulated SIF.
Though the SCOPE model can simulate SIF and photosynthetic rate, the latter is not sensitive to chlorophyll content. The new LUEf model produced by the ecological scientists eliminates this uncertainty by incorporating fluorescence.

The GPP calculated by using the SIF spatial maps for 760nm and TOC were more sensitive to seasons than the original LUE, which does not include SIF. Moreover, GPP SIF-TOC and GPP SIF-760 were closely related to GPP-EDDY calculated from the meteorological eddy covariance data at the landscape level, with R2 = 0.91 and R2=0.89, respectively. GPP-MODIS estimates were far lower than GPP-EDDY and were not accurate enough.
Though GPP-EDDY estimations are very accurate, they are site-based, and the LUEf models now provide an easier and cheaper method of estimating GPP precisely on a larger scale. Moreover, satellite data can be collected, in real-time, which is also cheaper and less tedious to gather than field-based observations. The new model can also be used in different types of forests.
SIF inclusion also makes models more sensitive. The GPP estimation from the LUEf model is higher, as both SIF and GPP are closely related to the same parameters: chlorophyll content, LAI, leaf thickness and water content, and dry matter. In comparison to older models, the new SIF-based model covers more of the factors, which influence GPP, making its estimates of productivity more accurate.
Improving Carbon Flux Measurements
It is important to estimate GPP to get an idea of carbon sequestration and the health of ecosystems. GPP can be influenced by several environmental factors. This study skirts these issues by creating a model that uses the well-established relationship of SIF with plant productivity to scale estimation from tree to landscape scale. Moreover, people can now estimate GPP in real-time so that carbon flux in different seasons and times of years can be tracked efficiently.
—
Vijayalaxmi Kinhal
Science Writer, CID Bio-Science
Ph.D. Ecology and Environmental Science, B.Sc Agriculture
Sources
Sinha, S.K., Padalia, H., Patel, N.R., & Chauhan, P. (2021). Modelling sun-induced fluorescence for improved evaluation of forest carbon flux (GPP): Case study of tropical deciduous forest, India. Ecological Modelling, 449, https://doi.org/10.1016/j.ecolmodel.2021.109552.
Related Products
Most Popular Articles
- Transpiration in Plants: Its Importance and Applications
- Leaf Area – How & Why Measuring Leaf Area…
- How to Analyze Photosynthesis in Plants: Methods and Tools
- Plant Respiration: Its Importance and Applications
- The Forest Canopy: Structure, Roles & Measurement
- Stomatal Conductance: Functions, Measurement, and…
- Forest & Plant Canopy Analysis – Tools…
- Root Respiration: Importance and Applications
- 50 Best Universities for Plant Science
- The Importance of Leaf Area Index (LAI) in…