November 17, 2025 at 5:13 pm | Updated November 17, 2025 at 5:13 pm | 8 min read
TLDR
- Leaf area index (LAI) field methods are classified into two categories: destructive, direct methods and non-destructive, indirect methods.
- LAI estimations by the indirect method across the ecosystem, plant, and species are lower than those obtained directly.
- Clumping, non-random leaf distribution in the canopy, seasonality, and inadvertent inclusion of contributions by woody parts can affect LAI accuracy.
Leaf area index (LAI) can be estimated from field measurements and remote sensing data. Several approaches are used in field estimations of LAI. The choice of methods depends on the species and the research needs. However, while choosing a method, scientists should be aware of the inherent characteristics of each process that can influence the accuracy of LAI estimations.
Leaf Area Index and Its Importance
Leaf area index (LAI) indicates the amount of leaf area in a canopy. The most commonly used definition considers it as the one-sided leaf area per unit ground area. It is a unitless parameter used in crop and ecosystem management.
Subscribe to the CID Bio-Science Weekly article series.
By submitting this form, you are consenting to receive marketing emails from: . You can revoke your consent to receive emails at any time by using the SafeUnsubscribe® link, found at the bottom of every email. Emails are serviced by Constant Contact
LAI indicates the leaf area available for photosynthesis, precipitation interception, respiration, and transpiration for the plant. A high LAI increases the surface area for light radiation interception and carbon dioxide intake, thereby boosting photosynthesis and productivity. However, a high LAI indicates increased transpiration and water loss, as well as greater soil water uptake. A larger leaf area also improves respiration and the utilization of biomass for plant energy needs. Therefore, higher LAI is not always desirable. The optimal LAI can vary by crop type and species. LAI varies with stress factors, such as water and nutrient deficiencies, diseases, and pests, and thereby serves as an indicator of plant health.
- In crop management, primarily through precision agriculture, LAI is used to inform fertilizer and irrigation needs and to predict yield.
- In natural ecosystems, LAI provides insights into the carbon and water cycle, and forest growth and productivity. LAI influences the microclimate in and under the canopy by controlling light extinction and water vapor and gas exchanges.
The LAI is one of the most widely used plant parameters in agricultural, climate, ecosystems, hydrological, and biochemical disciplines. Several methods exist to estimate it, and the choice of the process depends on the objective.
LAI estimates are derived from field measurements and remote sensing. Each of these methods has its advantages and disadvantages that will influence the value of LAI estimates.
LAI Field Estimations
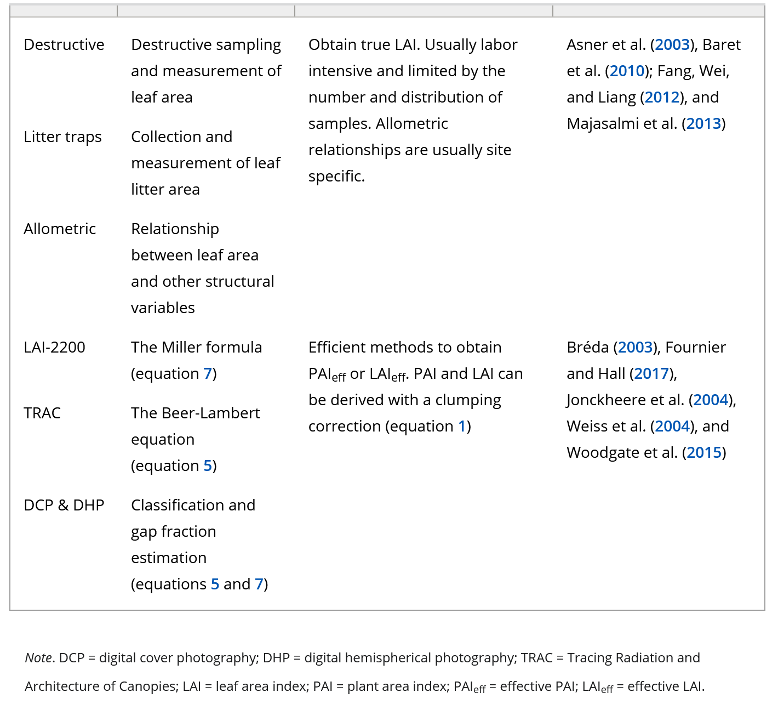
The LAI estimates obtained from field measurements can be either direct or indirect, as shown in Table 1.
Direct measurements
Direct measurements include destructive leaf sampling to determine the leaf area, and the established allometric relationships are specific to the site and species. The direct methods still serve as a reference for calibrating LAI estimates from many indirect methods. Instruments such as leaf area meters can be used for the purpose. However, tools such as the CI-202 Portable Laser Leaf Area Meter and CI-203 Handheld Laser Leaf Area Meter can be used to measure leaf area without destructive leaf sampling. This direct method is used for short plants in grasslands and tundra, as well as for crops.
Leaves collected from the litter are also used to estimate leaf area and LAI directly.
Table 1: “Major Field LAI Measurement Methods,” Fang et al. 2019. (Credits: https://agupubs.onlinelibrary.wiley.com/doi/full/10.1029/2018RG000608)
Indirect measurements
Indirect measurements are non-destructive and include the use of allometric equations and optical methods.
- Allometric equations utilize relationships between leaf area and other easily measurable structural variables, such as stem diameter at breast height. Canopy cover and canopy height can also serve as additional biophysical features to improve the allometric equations.
- Indirect optical methods estimate LAI through the canopy gap fraction approach, which measures transmission of radiation through the canopy. This method helps estimate LAI in crops, deciduous, and coniferous tree stands. LAI estimation is influenced by leaf-angle distribution. Equations such as the Beer-Lambert law utilize incident light above and below the canopy, which is influenced by canopy architecture and stand structure. Approximately 10% of variations in LAI estimations by the Gap Fraction method are attributed to leaf inclination.
- Hemispherical images taken with fisheye lenses can provide information on LAI and canopy structure, calculate solar radiation indices, and map microclimates. This method can measure vertical and horizontal canopies. The images need to be analyzed by software. Bréda (2003) singles out the CI-110 Plant Canopy Imager by CID BioScience Inc. because the digital camera captures color images and processes them in real time in the field. The tool requires no reference measurements and uses a gap fraction inversion technique proposed by Norman and Campbell (1989), accounting for sky view, foliage distribution, the mean foliage inclination angle, and the canopy extinction coefficient.
Remote Sensing Methods
Remote-sensed data from satellites, airplanes, and drones have been used in the last few decades, along with analysis models. They are useful for precision agriculture, as well as large-scale studies.
LAI is estimated using vegetative indices and light reflectance at multiple wavelengths. Among the wavelengths, near-infrared light interacts most with the biocompounds, whose concentrations in the leaf determine the amount of reflectance. Reflectance is also influenced by canopy structure and the number of leaf layers.
Various vegetative indices, which use reflectance at different wavelengths, serve as proxies for LAI. Specific Vegetative indices and LAI show a strong correlation and are helpful for LAI estimation. However, each VI has drawbacks; for example, NDVI is sensitive to soil proportion in the background.
Reflectance data is also analyzed through various models to estimate LAI directly. Several global LAI models/products exist, including MODIS, GEOV1, GIMMS 3g, GLASS, GLOBCARBON, and VIIRS. These models use three LAI inversion methods: empirical, physical, and machine learning.
- The empirical method is efficient and straightforward, but it is affected by factors such as vegetation type, season, terrain, and others. Therefore, its application to large-scale surveys and complex vegetation is challenging.
- The physical method utilizes a wide range of wavelengths and is more universally applicable, although the inversion process is complex.
- Machine learning models are becoming increasingly popular for handling large datasets.
Vis can be incorporated into these models.
Comparing Field LAI Estimates
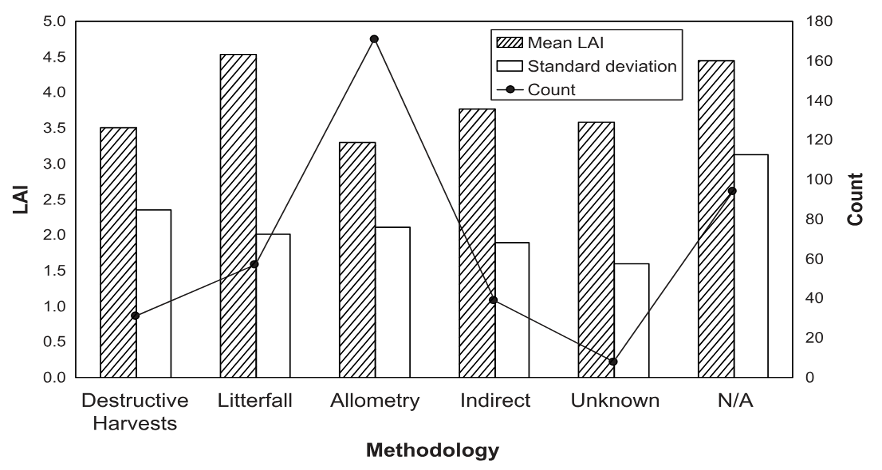
Figure 1: “Statistics of LAI database organized by measurement methodology,” Asner et al. 2003. (Image credits: DOI:10.1046/j.1466-822X.2003.00026.x)
While different LAI measurement systems are suitable for various situations and plant types, comparing estimations for the same species reveals differences in method accuracy. We confine the discussion in this article to differences within field method measurements.
Scientists have found, across several studies, that Indirect methods underestimate LAI compared to direct methods. One study found that variation can be as high as 25-50%. Another study (Asner et al 2003) reviewed 1000 peer-reviewed papers of measurements of LAI in 400 field sites, including croplands, temperate needleleaf and broadleaf forests, tropical forests, savanna, plantations, grasslands, tundra, deserts, and shrublands. Based on ecosystems, plantations had the highest LAI, followed by temperate evergreen forests and wetlands. The ecosystems with the lowest LAI were deserts. Grasslands had a higher LAI than deserts, and tundra had more than grasslands.
There is no statistical difference in LAI estimates across all ecosystems, regardless of the method used. Still, the mean LAI estimated by direct methods was higher than that estimated by indirect methods (see Figure 1).
A decline in LAI is observed from the 1990s onwards, as indirect methodologies became more common in this decade, whereas direct methods were the standard techniques in the prior decades; see Figure 2.
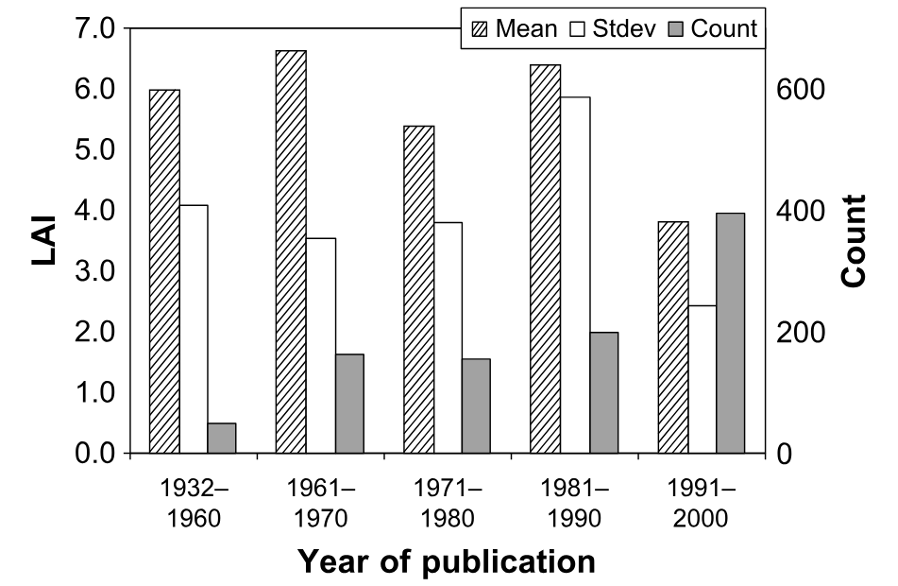
Figure 2: “Statistics of LAI database organized by year of publication,” Asner et al. 2003. (Image credits: DOI:10.1046/j.1466-822X.2003.00026.x)
Several reasons for the difference between direct and indirect Lai estimations have been identified. These are listed below.
- Clumping of trees and plants: The LAI methods assume that the sampled trees and plants are randomly distributed. However, trees and plants can occur in clumps, or, in the case of crops and plantations, they are often arranged in straight rows. Whether a canopy is closed and continuous or discontinuous with gaps will influence the LAI of the same species. Spatial aspects of sampling must vary in each case.
- Non-random distribution of leaves: LAI estimates for a single tree, shrub, or herb assume a random distribution of foliar elements within a canopy. However, in nature, the distribution of leaves can vary. So, leaf area density, which is foliage area divided by canopy volume, can be included in equations. Additionally, the distance to the neighboring plant crown should be considered.
- Seasonality: Radiation-based methods are influenced by the season and even the time of day when measurements are taken. LAI measurements should not be taken in the morning or evening due to changes in light diffusion. LAI will change with the season, especially in deciduous forests, but also in evergreen and tropical forests. In row crops, temporal variations in LAI occur due to the canopy closure in the fast-growing plants. Therefore, the extinction coefficient, clumping, and the relationship between plant area index and LAI change during the crop cycle.
- Inclusion of woody elements: An additional source of discrepancy arises for forests and shrubs. Most optical methods actually estimate the entire Plant Area Index (PAI) rather than LAI, because stem and branch contributions are included. The contribution of woody elements is measured by the Wood Area Index (WAI). The proportional contribution of WAI to PAI varies across different ecosystems, as illustrated in Figure 3. The contribution of woody parts to PAI can vary between 5-35% and depends on the season and clumping. WAI can be estimated during the season when plants have no leaves, or using NIR cameras. The WAI must be subtracted from PAI to get an accurate LAI: (LAI=PAI–WAI). However, the procedure to get LAI from PAI is still not settled in the scientific community.
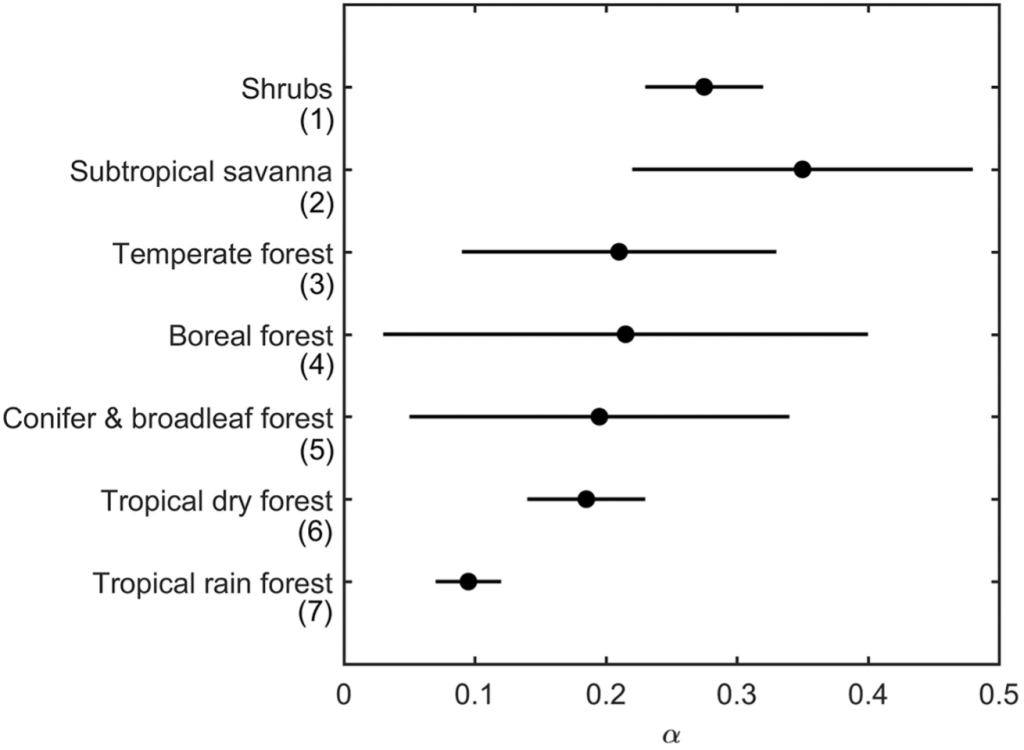
Figure 3: “The range of typical values of woody-to-total-plant-area ratio (α, equation 12) for different vegetation types.” Fang et al. (2019). (Image credits: https://doi.org/10.1029/2018RG000608).
Try the CI-110 Plant Canopy Imager
Breda (2003) found that the CI-110 Plant Canopy Imager by CID BioScience Inc. has addressed issues that negatively impact LAI estimations, such as the non-random distribution of leaves, leaf angle inclination, and the canopy extinction coefficient. The device also features preloaded software for real-time analysis of complex images in the field, saving researchers time. The tool is also user-friendly and requires no prior training or additional image analysis skills. Since the scientific community relies heavily on LAI, a precise, portable device like the CI-110 Plant Canopy Imager can significantly accelerate research across various disciplines.
Book a consultation with CID BioScience Inc. to find out more about the CI-110 Plant Canopy Imager for your research needs.
Sources
Asner, G. P., O. Scurlock, J. M., & Hicke, J. A. (2003). Global synthesis of leaf area index observations: Implications for ecological and remote sensing studies. Global Ecology and Biogeography, 12(3), 191-205. https://doi.org/10.1046/j.1466-822X.2003.00026.x
Bréda, N. J. (2003). Ground‐based measurements of leaf area index: A review of methods, instruments and current controversies. Journal of Experimental Botany, 54(392), 2403-2417. https://doi.org/10.1093/jxb/erg263
Fang, H., Baret, F., Plummer, S., & Schaepman-Strub, G. (2019). An Overview of Global Leaf Area Index (LAI): Methods, Products, Validation, and Applications. Reviews of Geophysics, 57(3), 739-799. https://doi.org/10.1029/2018RG000608
George, J., Yang, W., Kobayashi, H., . . . Pisek, J. (2021). Method comparison of indirect assessments of understory leaf area index (LAIu): A case study across the extended network of ICOS forest ecosystem sites in Europe. Ecological Indicators, 128, 107841. https://doi.org/10.1016/j.ecolind.2021.107841
Lv, F., Sun, K., Li, W., Miao, S., & Hu, X. Estimation of Leaf Area Index across Biomes and Growth Stages Combining Multiple Vegetation Indices. Sensors, 24(18), 6106. https://doi.org/10.3390/s24186106
Ma, J., Zhang, J., Wang, J., Khromykh, V., Li, J., & Zhong, X. Global Leaf Area Index Research over the Past 75 Years: A Comprehensive Review and Bibliometric Analysis. Sustainability, 15(4), 3072. https://doi.org/10.3390/su15043072
Related Products
Most Popular Articles
- Transpiration in Plants: Its Importance and Applications
- Leaf Area – How & Why Measuring Leaf Area…
- How to Analyze Photosynthesis in Plants: Methods and Tools
- Plant Respiration: Its Importance and Applications
- The Forest Canopy: Structure, Roles & Measurement
- Stomatal Conductance: Functions, Measurement, and…
- Forest & Plant Canopy Analysis – Tools…
- Root Respiration: Importance and Applications
- The Importance of Leaf Area Index (LAI) in…
- 50 Best Universities for Plant Science
