What Are the Causes Behind Global Plant Transpiration Trends?
Dr. Vijayalaxmi Kinhal
July 21, 2025 at 5:20 pm | Updated April 14, 2026 at 3:47 am | 5 min read
- An increase in the rate of transpiration is observed over approximately 70% of the global land surface.
- The hike in transpiration over the past four decades is due to greener landscapes.
- The increase in greenery is attributed to a higher Leaf Area Index, driven by carbon fertilization and higher global temperatures.
- Lower stomatal conductance, due to increased carbon dioxide levels and land-use and cover changes, offsets the positive effects of greenery on transpiration rates.
Plant transpiration affects the environment from the microsite to the global scale. On a worldwide scale, plant transpiration is a vital component of the Earth’s hydrological cycle and plays a crucial role in regulating regional weather patterns. It also influences the water balance and productivity of terrestrial ecosystems. This article reviews some of the reasons behind the increase in plant transpiration over the decades.
Why Global Plant Transpiration Levels Are Important
Plants transpire mainly through the stomata on their leaves. The physiological process is crucial for plant survival, growth, and productivity. However, the importance of plant transpiration is also felt in the immediate environment, influencing the microclimate by reducing air temperature. The effects of transpiration are also felt far beyond the plant’s vicinity, affecting regional and global-scale water exchange balances between land and the atmosphere.
Global plant transpiration removes water from the soil and transfers it to the atmosphere. As a result, the amount of water available for the natural terrestrial ecosystem, farming, and other human activities decreases. Enhanced transpiration does increase regional incidences of precipitation, returning some water and offsetting losses through transpiration.
Subscribe to receive our monthly round-up of articles.
The immediate effect of soil moisture reduction is a change in vegetation water balance. Loss of soil moisture causes drought stress in 70% of vegetation, especially in semiarid regions. Available soil water supports plant growth, helping plants and ecosystems fix more carbon. Thus, the ability of vegetation to act as carbon sinks is also compromised due to high transpiration. In addition, available moisture affects the soil and atmospheric energy balance. Soils with more moisture lose more heat through radiation and support higher primary productivity.
Considering the significance of transpiration across various scales, accurately measuring it at the global level has become crucial.
Plant Transpiration Trends
Chen et al. (2024) estimated an increase in global plant transpiration of 397.2 ± 63.1 mm between 1990 and 2020. This represents an increase of 0.79 ± 0.28 mm/year, or approximately 6%.
Similarly, Zhang et al. (2016) also found plant transpiration increased by 0.72 ± 0.23 mm/year from 1981 to 2012. Cui et al. (2024) also report that global plant transpiration increased by 0.61–0.79 mm yr−2 from 1980 to 2021.
This tendency of higher transpiration was observed in over 70% of the world’s terrestrial surface. Areas like Africa, India, China, mid- and eastern North America, Europe, and Siberia are experiencing higher plant transpiration rates. At the same time, a decrease in transpiration is occurring in water-limited regions, such as parts of South America, Central Asia, western North America, and certain parts of Australia. The increase in plant transpiration comes from various forests, grasslands, and croplands in semi-arid and semi-humid areas.
Evapotranspiration Trends
Previous research had established that transpiration accounts for 60% of soil moisture loss in terrestrial evapotranspiration.
Recorded evapotranspiration (ET) has also increased over the years. For example, Zhang et al. (2016) found that ET increased by +0.63 mm year−2, and Yang et al. (2023) found an ET increase of 0.66 ± 0.38 mm year−2 from 1982 to 2011, as well as a 1.19 ± 0.31 mm year−2 increase between 2001 and 2020.
ET includes plant transpiration, soil evaporation, water surface evaporation, and canopy-intercepted water. Studies show that transpiration has increased more than evapotranspiration in recent decades.
Role of LAI
Many studies have shown that an increase in plant transpiration is associated with an increase in greenery. Most scientists have quantified greenery in terms of Leaf Area Index (LAI), which is half the area of leaves per unit area of ground. They found that the boost in transpiration rate was positively correlated with an increase in LAI. Nearly 90% of transpiration occurs through leaves, so as the LAI increases, transpiration also increases.
Nearly half the globe has experienced a surge in LAI since the 1980s. In regions like China, most of the boost in LAI has occurred in forests and croplands.
Studies vary in their estimates of the importance of LAI in explaining the increase in transpiration. Chen et al. (2024) found that changes in LAI could explain 66.2% of the plant transpiration. However, Cui et al. (2024) say LAI accounts for 40% of the transpiration, and climate change explains 19% of the increase.
![]()
Figure 1. “Attribution of transpiration trend. (a) Drivers of transpiration trend at the global scale from 1980 to 2021. (b) Combined effect. (c) Climate change. (d) CO2-induced LAI increase (CO2_LAI). (e) CO2-induced stomatal closure (CO2_Stomata). (f) The combined effect of CO2_LAI and CO2_Stomata. (g) Land use and cover change (LUCC),” Cui et al. 2024. (Image credits: https://doi.org/10.1029/2024GL108302).
Climate Change
Climate change, marked by an increase in carbon dioxide (CO2) and temperature, explains the current greener landscapes, see in Figure 1.
- CO2: A 27% increase in LAI occurs because the increased atmospheric CO2 causes CO2 fertilization. The CO2 fertilization effect is higher in regions with high LAI than in areas with low LAI.
- Temperature: Regions where plant growth was previously restricted by warmth now have more vegetation, resulting in higher transpiration rates due to higher climate-change-driven temperatures. Growing seasons are also becoming extended, especially in temperate regions, allowing areas to remain greener for more extended periods of the year.
However, climate change has also reduced transpiration due to stomatal closure. According to Cui et al. (2024), there has been a 38% increase in stomatal closure due to higher CO2 concentrations, which will limit transpiration.
Land use and cover changes decrease transpiration by 3%, because forests are converted to croplands or urban areas with less LAI. Land use and cover change increased transpiration in only a few places, like southern South America, eastern and central North America, and eastern China.
These studies are significant because future predictions show an increase of 0.86 mm/year to 1.45 mm/year for different climate change scenarios up to 2100. It will have profound implications for water, crop, and forest management worldwide. Scientists are already working to find ways to limit climate change-driven increases in transpiration in crops, thereby reducing soil moisture loss and enhancing photosynthesis and crop productivity.
Plant Transpiration Measurements
Estimating changes in transpiration on a global scale has been challenging. However, scientists point out that using the increasing number of plot-scale transpiration estimations is invaluable in validating predictions by various transpiration algorithms and land surface models. Plot-scale transpiration measurements can be used beyond benchmarking to optimize models and improve transpiration estimates.
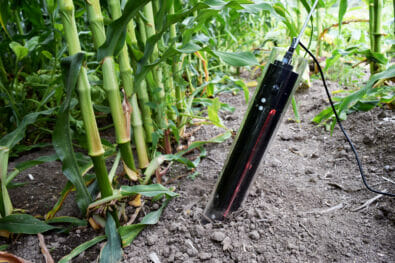
The availability of portable precision tools that can be used onsite can facilitate data collection. CID Bio-Science Inc. offers several precision devices to expedite field work on transpiration changes.
- The CI-340 Handheld Photosynthesis System can measure transpiration, stomatal conductance, and photosynthesis simultaneously in real-time. The instruments feature various modules that control temperature, light, CO2, and moisture within the measuring chamber.
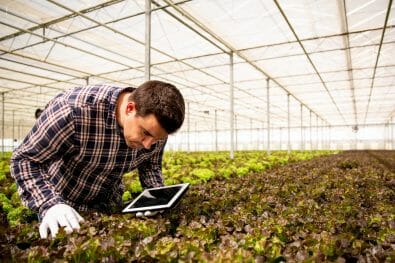
- The CI-110 Plant Canopy Imager can measure LAI.
Contact CID Bio-Science Inc. to learn how we can assist with your research needs.
Sources
Chen, H., Wei, Y., & Huang, J. J. (2024). Widespread increase in plant transpiration driven by global greening. Global and Planetary Change, 235, 104395. https://doi.org/10.1016/j.gloplacha.2024.104395
Cui, J., Ding, J., Lian, X., Wei, Z., Li, S., Peng, J., Poyatos, R., Wang, T., & Piao, S. (2024). Observational Constraints and Attribution of Global Plant Transpiration Changes Over the Past Four Decades. Geophysical Research Letters, 51(11), e2024GL108302. https://doi.org/10.1029/2024GL108302
Li, M., Wu, P., Ma, Z., Pan, Z., Lv, M., Yang, Q., & Duan, Y. (2022). The Increasing Role of Vegetation Transpiration in Soil Moisture Loss across China under Global Warming. Journal of Hydrometeorology, 23(2), 253-274. https://doi.org/10.1175/JHM-D-21-0132.1
Yang, Y., Roderick, M. L., Guo, H., Miralles, D. G., Zhang, L., Fatichi, S., … & Yang, D. (2023). Evapotranspiration on a greening Earth. Nature Reviews Earth & Environment, 4(9), 626-641.
Zhang, Y., L., J., McVicar, T. R., Chiew, F. H., Vaze, J., Liu, C., Lu, X., Zheng, H., Wang, Y., Liu, Y. Y., Miralles, D. G., & Pan, M. (2016). Multi-decadal trends in global terrestrial evapotranspiration and its components. Scientific Reports, 6(1), 1-12. https://doi.org/10.1038/srep19124
Related Products
Most Popular Articles
- Transpiration in Plants: Its Importance and Applications
- Leaf Area – How & Why Measuring Leaf Area…
- How to Analyze Photosynthesis in Plants: Methods and Tools
- Plant Respiration: Its Importance and Applications
- The Forest Canopy: Structure, Roles & Measurement
- Stomatal Conductance: Functions, Measurement, and…
- Forest & Plant Canopy Analysis – Tools…
- Root Respiration: Importance and Applications
- 50 Best Universities for Plant Science
- The Importance of Leaf Area Index (LAI) in…