Canopy Cover Research 2024: 5 Breakthrough Findings You Need to Know

Dr. Vijayalaxmi Kinhal
February 12, 2025 at 6:04 pm | Updated April 14, 2026 at 4:05 am | 11 min read
- In 2024, studies focused on the combined effects of canopy cover along with those of other vegetation traits and environmental conditions.
- The crucial role of canopy cover in plant drought response strategies in various ecosystems and applications is an emergent theme.
- Canopy cover is also essential in studies promoting sustainable solutions from urban cooling, regenerative agriculture, and forest management.
Canopy cover is a crucial vegetation trait for plants, productivity, and ecosystem dynamics. While the effects of canopy cover are well-studied, continuing research addresses gaps, especially in the context of climate change. This article covers five exciting findings made in 2024 about canopy cover.
-
Tree Canopy Quality and Water-use Strategies in Urban Cooling
Cities worldwide aim to increase their canopy cover in urban areas. A global target wants 30% canopy cover, while the European Union wants a minimum of 10% to reduce urban temperatures and for other benefits.
Urban tree canopy cover mitigates heat by reflecting or absorbing the solar radiation that would have otherwise heated buildings. Trees also cool themselves through transpiration or water vapor loss, which cools the surrounding air. The cooling benefits depend on the extent and denseness of canopy cover, which are species-specific. However, the list of traits to base species selection for urban cooling is missing.
Subscribe to receive our monthly round-up of articles.
Review
Rahman et al. 2024, reviewed research articles to understand trends in the physical characteristics of trees and their influence on cooling and application of small-scale tree growth models. The scientists have identified some trends and also propose four research priorities that can help understand these issues can influence urban cooling by trees:
i. Focus on canopy quality, not just quantity: Instead of focusing only on tree crown size, the scientists think parameters like leaf area index (LAI), which is the leaf cover per unit ground area, and leaf angle distribution function (LADF) should also be considered as they influence the amount of solar radiation passing through canopies. LAI can be reduced by drought and disease that lead to leaf loss. These factors will also affect canopy clumsiness or the tendency of leaves to form clusters around branches. As a result, more radiation seeps through and reduces a tree’s cooling effect. LAI also varies due to species and tree vigor, see Figure 1.
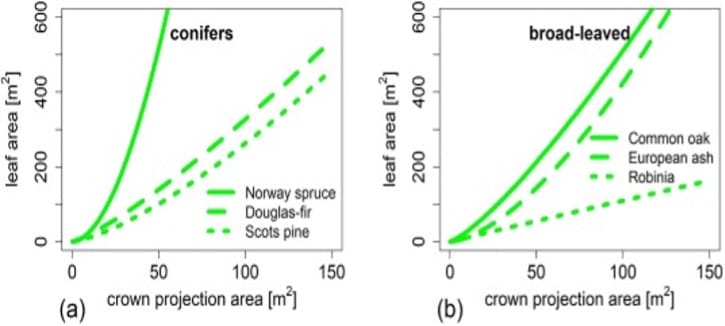
Figure 1: “Allometric relationship between leaf area and crown projection area shown for selected (a) conifers and (b) broad-leaved species. Crown quantity in terms of crown projection area can come along with very different species-specific crown quality in terms of leaf area,” Rahman et al. 2024. (Image credits: https://doi.org/10.1016/j.landurbplan.2024.105089)
ii. Tree heat and drought response strategies: Three broad drought response strategies by trees were identified based on morphology and physiology:
- Water spenders access groundwater through deep roots and maintain high transpiration with no stomata regulation. They shed leaves and have a lower-quality canopy in summer, and they will need irrigation, such as Eucalyptus camaldulensis.
- Water savers or avoiders close their stomata or drop leaves to reduce transpiration. They have a higher water status even during drought, for example, Robinia pseudoacacia. However, they will close their stomata mid-day during the warmest times, providing less transpiration cooling.
- Drought tolerators have narrow xylem vessels and don’t rely on stomata closure to survive low soil water conditions. These trees can have strong stomata control and leaf drop, for example, Platanus × hispanica.
These drought responses exist on a continuum of environmental conditions, and the canopy will change in dry and wet weather based on transpiration levels, see Figure 2. The species selection must consider environmental and socio-economic factors such as city population, infrastructure, etc.
iii. Urban tree cooling benefits in different climatic zones: Tree cooling effects of air and surface temperature reduction in various regions are known. However, the varying contributions by shade and transpiration have not been disentangled, nor how they vary in different climatic zones. Standardized protocols for data collection on urban cooling by trees incorporating the same parameters like LAI, city albedo, surface type, and climate can help form a global-level understanding.
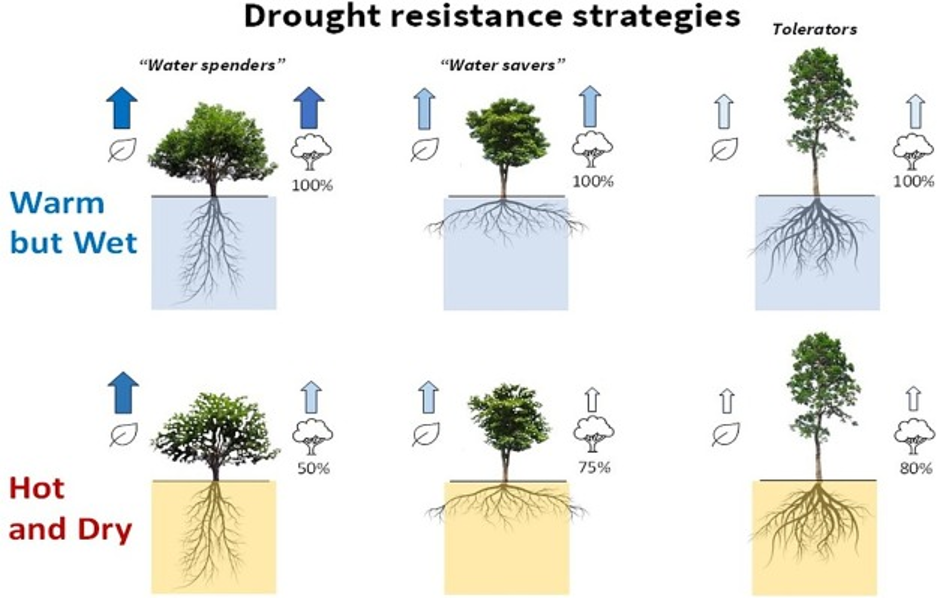
Figure 2: “Three types of tree drought resistance strategy and their impact on transpiration at the leaf level (), as well as canopy leaf area and, therefore, transpiration at the canopy level (), under warm, wet conditions (upper) and hot, dry conditions (lower). Numbers and arrow sizes are rough estimates of the influence of the two contrasting climatic conditions,” Rahman et al. 2024. (Image credits: https://doi.org/10.1016/j.landurbplan.2024.105089)
iv) Urban-level cooling benefits: The three previous suggestions were for tree-specific research, while the last one concerns stand-level features like vulnerability to climate change, local stress factors, competition among trees for resources, and spatial configuration. Remote sensed data analyzed by “atmospheric boundary layer models” is suggested.
Takeaway: The review takes stock of available information and provides suggestions for globally coordinated long-term research priorities to optimize urban cooling through suitable tree species selection for planting.
-
Machine Learning Models For Canopy Cover Estimation
Wood is and will remain a significant source of renewable energy. In Finland, wood contributes 28.5% of energy, and the demand is expected to rise to reduce reliance on fossil fuels. Young forests are substantial biomass reservoirs, where canopies are vital for biomass formation. Tree canopy cover monitoring is critical, but field methods are cost, time, and labor-intensive. So, remote sensed multispectral images are analyzed using vegetation indices in models. However, predictive approaches and accuracy vary among analytical models.
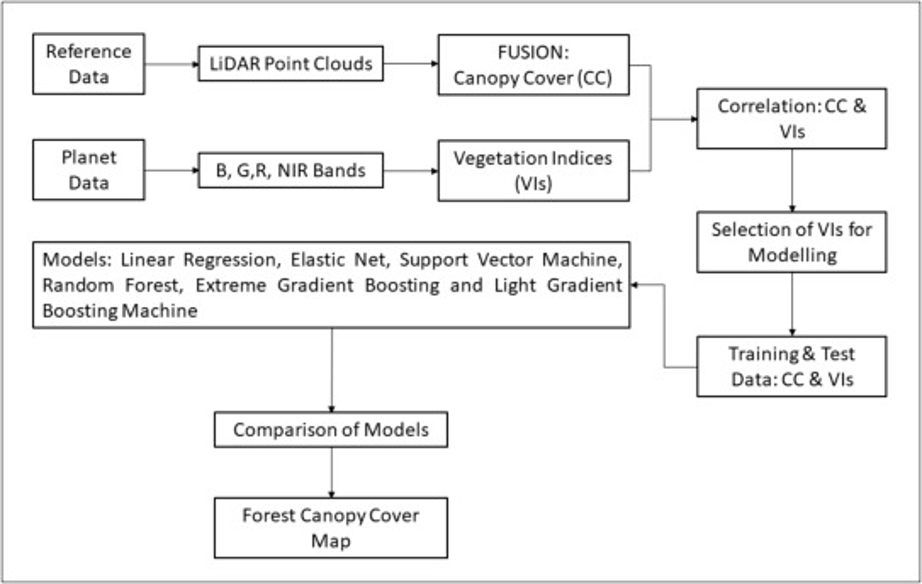
Figure 3: “The workflow chart of forest canopy cover estimation in this study,” Gyawali et al. 2024. (Image credits: https://doi.org/10.1016/j.ecoinf.2024.102706)
Experiment
Since canopy cover estimations are few for young boreal forests, Gyawali et al. 2024. tested the analytical ability of simple and machine learning models in analyzing PlanetScope satellite’s multispectral (eight bands) images, using 43 vegetation indices and some individual band and salinity-based indices. Different indices were used for varying simple and machine-learning models. They used six regression models- linear, elastic net (Enet), support vector machine (SVM), random forest (RF), extreme gradient boosting (XGboost), and light gradient boosting machines (LightGBM). Light detection and ranging (LiDAR) data analyzed by FUSION software acted as reference canopy cover for the forest.
The results show that all models performed well in analyzing training and testing datasets. The LightGBM models had the highest forest canopy cover prediction scores, although they were not significantly different from the other models.
Machine learning models (R2=0.69) predict forest canopy cover more effectively than simple models (R2=0.58). Machine learning models can account for 69% of the data variability, while simple models explain only 58%. Vegetation indices NDVI, GARI, MSR, and GNDVI were the best predictors of forest canopy cover in machine-learning models. The results identified areas with sparse growth, differentiating them from freshly harvested areas.
Takeaway: The scientists recommend using Planet multispectral data analyzed by light gradient boosting machine regression models to estimate young boreal forest canopy cover.
-
Canopy Cover and Microtopography Effect Permafrost
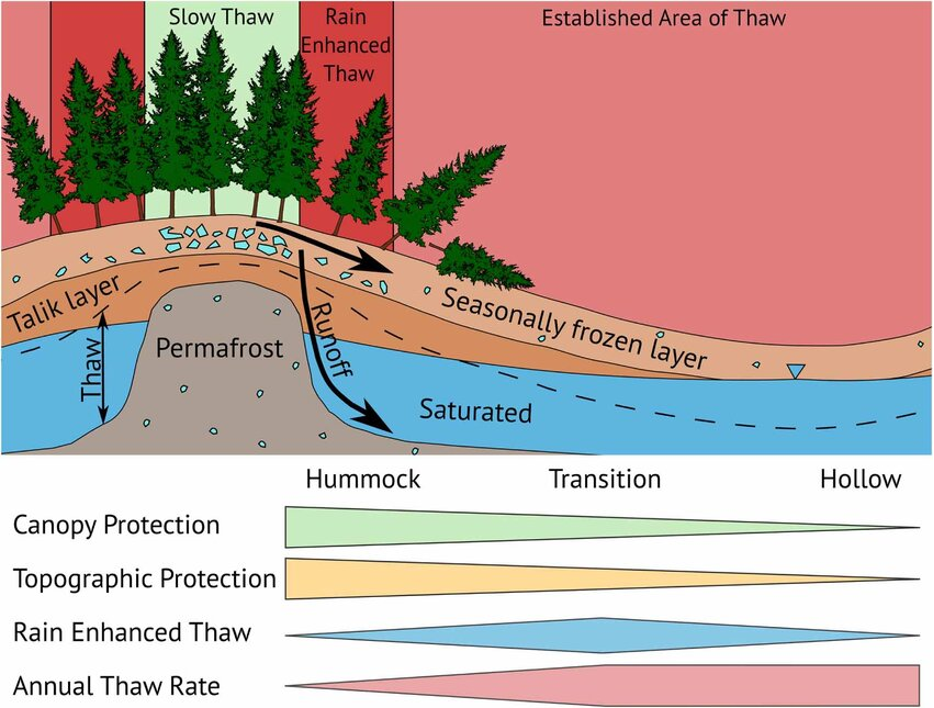
Figure 4: “Conceptual overview. The top section shows a permafrost plateau cross-section. Light red represents areas expected to thaw rapidly with or without large rain events, and dark red represents areas only expected to thaw rapidly in the presence of large rain events. Light blue geometric shapes represent soil ice content. A blue triangle marks the top of the water table. Thick black arrows show subsurface flow paths of rain-induced runoff that can warm soil through advective heat transport. A thin black arrow shows the thaw that took place between 2020 and 2022. A dashed black line represents the depth to permafrost before 2020. The seasonally frozen layer is shown in light tan, the talik layer is shown in dark tan, and permafrost is shown in gray. The bottom section shows the relative magnitude of canopy protection, topographic protection, rain-enhanced thaw, and annual thaw rates among hummock, transition, and hollow locations. Canopy protection and topographic protection refer to the slowing of permafrost thaw caused by dense canopy cover and high relative-elevation, both of which reduce snow depth and soil moisture, which are known to accelerate permafrost thaw,” Eklof et al. 2024. (Image credits: DOI:10.1088/1748-9326/ad31d7).
The permafrost cover of 24% in the Northern Hemisphere is shrinking because atmospheric temperatures are warmer than global averages. However, many environmental factors like local climate, snow, vegetation traits, soil, topography, and hydrology also play a part. Understanding how ecosystem-protected permafrost degrades can predict how more northern thaws occur.
Experiment
Eklof et al. 2024, studied the impact of rain, snow depth, microtopography, and canopy cover on thaw rates and the mechanisms responsible for it. The study was conducted in south-central Alaska, where the ecosystem-protected permafrost persists even in warm climates due to the favorable ecology of the site.
During the experiment, the site experienced three snowiest and three wettest years since 2015. Data of high-resolution soil temperature environmental variables showed that average permafrost thaw rates had increased ninefold from 6 ± 5 cm yr−1 to 56 ± 12 cm yr−1. It led to an increase in thawed areas or taliks. Previously isolated talik were connected due to expansion.
The thaw rate and mechanisms varied in the area. Figure 4 gives an overview of the mechanisms at work based on the experiment results.
Higher elevations or hummock, which have a dense canopy, thawed more slowly and at lower rates of 8 ± 9 cm yr−1. In contrast, hollows at low topographic points with less canopy cover and transitional areas with canopy cover between hummocks and hollows thawed faster and at higher rates of 44 ± 6 cm yr−1 and 39 ± 13 cm yr−1, respectively.
The study confirmed well-known trends that snow and rainfall increase thaw rates. Canopy cover and topography controlled the soil moisture levels and snow depth. Hummocks have less thawing due to the canopy cover that keeps them drier. Trees reduce snow depth by intercepting snowfall and decrease soil moisture through transpiration.
The underlying mechanisms differed in low and high thaw areas. Hollows have higher thermal conduction due to more soil moisture during the warm season and snow coverage during the cold season that insulates the soil. The transitional areas became warm and thawed due to the thermal energy transported from sub-surface taliks by rain events. The increase in depth to permafrost occurred below the ∼45 cm seasonally frozen layer, leading to talik expansion.
Takeaway: Canopy cover and microtopography are significant determinants of permafrost thaw rates. Since subsurface rain flows warm soils, the increase in rainfall due to climate change will hasten permafrost thawing.
-
Canopy Cover And Soil Moisture Shape Forest Understory Drought Responses
Climate change increases the frequency, duration, and intensity of heatwaves and drought. Due to climate change, the boreal region is expected to have longer and warmer summers. How the boreal forest trees will cope or respond to these conditions is unclear. Most research focuses on the primary forest canopy, but little is known about the long-term understorey responses to climate change. The boreal forest understory is rich in bryophytes and vascular plants with varying drought responses.
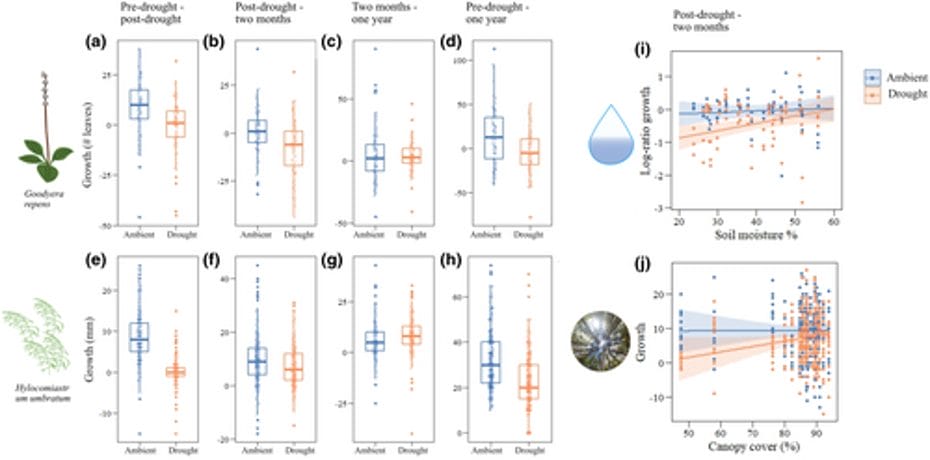
Figure 5: “Impact of drought on growth of Goodyera repens (a–d) and Hylocomiastrum umbratum (e–h). Interaction plots show effects of drought on growth 2 months after the drought treatment as a function of local soil moisture for G. repens (i), and canopy cover for H. umbratum (j),” Koelemeijer et al. (2024). (Image credits: https://doi.org/10.1111/gcb.17424).
Experiment
Koelemeijer et al. 2024 induced an experimental summer drought for 45 days at 25 sites using rainout shelters. They recorded responses of transplanted three vascular plants and three bryophyte species and compared them with controls with ambient canopy cover and soil temperature. The scientists checked plant growth, vitality, and reproduction- at the start of the experiment then two months and 1 year after drought.
The two questions they wanted to answer were as follows:
- How summer affected performance and lifespan of understory plants.
- How canopy cover and soil moisture influenced plant drought responses.
The scientists found that drought effects started immediately on all species. Throughout the study, drought effects on bryophytes were stronger and more persistent than on vascular plants and species associated with old forests. A moss (Hylocomiastrum umbratum) and an orchid (Goodyera repens) suffered more than generalists. Bryophytes become metabolically inactive due to desiccation, and these growth and vitality effects lasted for a year since they were adapted for stable and humid conditions. Reproduction was affected in moss Hylocomium splendens but increased for vascular plant Luzula pilosa.
Local environmental conditions influenced drought impacts, especially for bryophytes, see Figure 5. More canopy cover and soil moisture reduced drought effects for bryophytes two months after the drought. The buffering environmental implications for growth and vitality happened by reducing damage to internal structures. For vascular plants, soil moisture was important, as wetter soils helped them cope with drought.
Takeaway: The scientists concluded that drought effects on understorey plants vary over small spatial scales. They recommend that forest managers mitigate drought by protecting and conserving wet and shaded patches, especially those with sensitive species. Forest managers can also ensure continuous canopy cover and hydrological restoration of ditched areas and streams to help understory species in boreal regions.
-
Canopy Cover and Health of Winter Wheat in No-Till and Conventional Tillage Plots
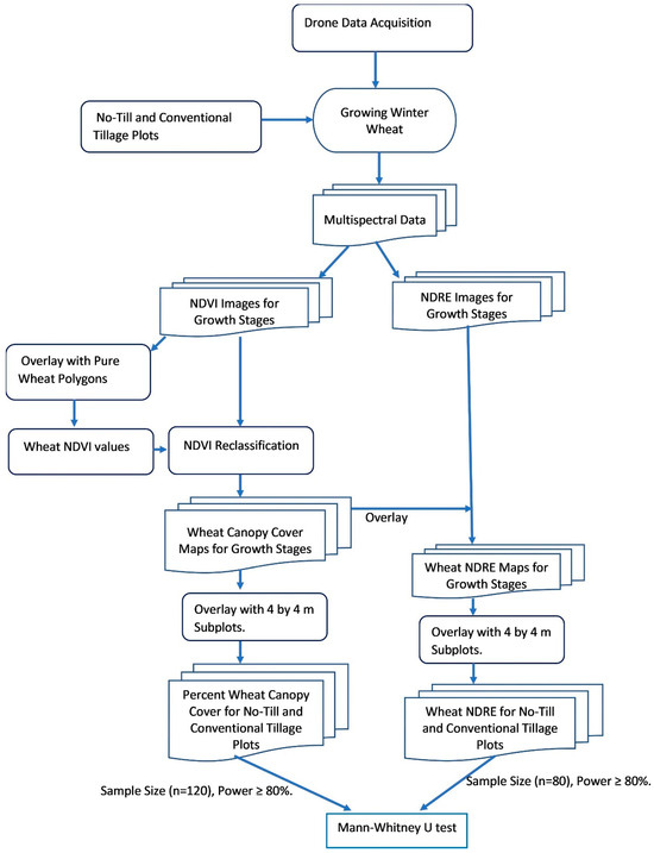
Figure 6: “Approach used to examine percent canopy cover and health of winter wheat in no-till and conventional tillage plots using drone,” Akumu et al. (2024). (Image credits: https://doi.org/10.3390/agriculture14050760)
Winter crops, such as grains like wheat, are essential to achieving food security. Wheat is the third most important field crop in the world. Wheat canopy cover and health are crop performance indicators for plant physiology, biomass, and yield potential. Tillage methods influence these two parameters, hence biomass accumulation and yield. Tillage could also influence crops’ spectral response and information on canopy cover and crop performance obtained from high-resolution drone spectral images. So far, limited studies have used high-resolution drone images to monitor winter wheat grown in different tillage systems and check for any such effects.
Experiment
Therefore, using drone image data, Akumu et al. 2024 compared the effects of no-till and conventional tillage on the winter wheat canopy cover. The study was conducted in silt loam soils at the Tennessee State University campus farm site. Winter wheat was grown on no-till and conventionally tilled plots, and multispectral drone data was collected during the growth phases. The drone data generated Normalized Difference Vegetation Index (NDVI) and The Normalized Difference Red-Edge (NDRE) images. These were used with wheat canopy cover maps to estimate wheat canopy cover percentage in no-till and conventional tillage. Figure 6 explains the rationale of the experiment.
NDVI images generated canopy cover maps for tillering, jointing, and heading stages. NDRE maps were produced for the middle and late stages to determine health.
The scientists found that during most of the growth phase, the average winter wheat canopy cover was higher in no-till plots (4%) than in conventionally tilled plots (1%). However, weed competition increased canopy cover by 4% in conventional tillage and 1% in no-till plots between the growth stage and heading. By heading stage, there was no statistically significant difference between total canopy cover in no-till plots (50%) and conventionally tilled plots (49%).
The NDRE values of 0.44 ± 0.01 for no-till and 0.43 ± 0.01 for conventional tillage plots during jointing and heading were also not significantly different.
Takeaway: Winter wheat canopy cover and health are similar in no-till and conventionally-tilled plots. Since no-till is less expensive and helps in soil carbon sequestration and soil moisture conservation, it is a better option for winter wheat growers.
Canopy Cover Measurements
Field experiments need instruments for accurate and rapid canopy cover and associated light interception measurements. CID Bio-Science Inc. offers the CI-110 Plant Canopy Imager that estimates canopy cover parameters like gaps, LAI, and PAR using a 150-fisheye camera. It is portable and has GPS and color filters. It is trusted by scientists for their canopy cover research.
Find out more about how the CI-110 Plant Canopy Imager can help your research.
Sources
- Rahman, M. A., Arndt, S., Bravo, F., Cheung, P. K., van Doorn, N., Franceschi, E., … & Torquato, P. R. (2024). More than a canopy cover metric: Influence of canopy quality, water-use strategies and site climate on urban forest cooling potential. Landscape and Urban Planning, 248, 105089.
- Gyawali, A., Adhikari, H., Aalto, M., & Ranta, T. (2024). From simple linear regression to machine learning methods: Canopy cover modelling of a young forest using planet data. Ecological Informatics, 82, 102706.
- Eklof, J. F., Jones, B. M., Dafflon, B., Devoie, É. G., Ring, K. M., English, M. E., … & Neumann, R. B. (2024). Canopy cover and microtopography control precipitation-enhanced thaw of ecosystem-protected permafrost. Environmental Research Letters, 19(4), 044055.
- Koelemeijer, I. A., Severholt, I., Ehrlén, J., De Frenne, P., Jönsson, M., & Hylander, K. (2024). Canopy cover and soil moisture influence forest understory plant responses to experimental summer drought. Global Change Biology, 30(7), e17424.
- Akumu, C. E., Oppong, J. N., & Dennis, S. (2024). Examining the Percent Canopy Cover and Health of Winter Wheat in No-Till and Conventional Tillage Plots Using a Drone. Agriculture, 14(5), 760
Related Products
Most Popular Articles
- Transpiration in Plants: Its Importance and Applications
- Leaf Area – How & Why Measuring Leaf Area…
- How to Analyze Photosynthesis in Plants: Methods and Tools
- Plant Respiration: Its Importance and Applications
- The Forest Canopy: Structure, Roles & Measurement
- Stomatal Conductance: Functions, Measurement, and…
- Forest & Plant Canopy Analysis – Tools…
- Root Respiration: Importance and Applications
- 50 Best Universities for Plant Science
- The Importance of Leaf Area Index (LAI) in…