Chlorophyll Fluorescence: Importance and Applications
Dr. Vijayalaxmi Kinhal
January 23, 2023 at 4:20 pm | Updated April 15, 2026 at 4:33 am | 9 min read
Chlorophyll fluorescence occurring in chloroplasts can give vital information about plant processes and status at the cell, leaf, individual, and regional scales. It is possible to measure this physiological phenomenon by a wide range of means, from portable handheld devices to satellite imagery. It is versatile enough to have crucial crop and natural ecosystem management applications.
Understanding Chlorophyll Fluorescence
Chlorophyll-a absorbs light that is partly used in photosynthesis (photochemistry) and partly emitted as heat. The portion of the absorbed light transmitted back as light is called fluorescence and is measured, even if it is only about 2% of the total incident light. Chlorophyll-a fluorescence occurs in the red and far-red wavelengths of light, see Figure 1.
If there is more photosynthesis, there will be less fluorescence and heat loss.
Subscribe to receive our monthly round-up of articles.
The three processes of photosynthesis, heat emittance and fluorescence can also be said to compete for light. Hence fluorescence can be quenched or extinguished by these two associated processes.
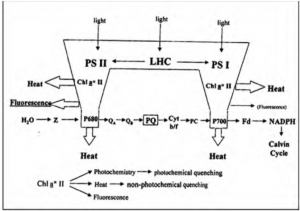
Figure 1: “Schematic illustration of primary conversion in photosynthesis which governs in vivo chlorophyll fluorescence yield. Variable fluorescence originates almost exclusively from PSII,” Mishra et al 2012. (Image credits: DOI:10.5772/35111)
The Process
Chlorophyll is the green-colored pigment-protein molecule in chloroplasts, found in the leaves of lower and higher plants. The pigment exists as part of two photosystems, PS I and PS II, that form part of the light-harvesting complexes (LHC) and are present on the thylakoid membrane of the chloroplasts. Chlorophyll-a is found in both photosystems along with associated molecules, including chlorophyll-b. The reaction center of PS I is Chl-a (P700) which absorbs light at 700 nm, and the reaction center of PSII is Chl-a (P680) which absorbs light at 680 nm, see Figure 1.
Though fluorescence occurs in both PS I and PS II, the contribution from the former is not significantly high and needs to be addressed.
The photons absorbed by PS II are used to split water and form oxygen and electrons. The latter is passed along in the electron transport system in PS II, to the next carrier (QA) or primary quinone acceptor of PSII, in a process called photochemical quenching. When QA has accepted an electron, it is “closed” and cannot accept any more electrons until the electron is passed on to the next acceptor, QB. Ultimately the electron is passed on to the PS I, which is used to reduce NADP+ to NADPH2. Carbon dioxide (CO2) is the final acceptor of the electrons in the process of photochemistry or photosynthesis.
When electrons are used in photochemistry through photochemical quenching, fluorescence is reduced. Non-photochemical quenching occurs when light is lost as heat; this process is essential to prevent damage to the photosynthetic apparatus and the formation of free oxygen radicals.
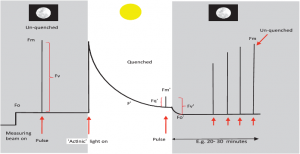
Figure 2: “A ‘typical’ fluorescence trace of the type that is repeatedly used to simplify the principles of chlorophyll fluorescence and provide an explanation of how we can derive important information about the performance of PSII by comparing fluorescence levels whilst exposing the leaf to a combination of actinic lights (i.e. light that drives photochemistry and photosynthesis), darkness, and a series of saturating pulses. This is based around the principle of separating the photochemical and non-photochemical components,” Murchie & Lawson (2013). (Image credits: DOI:10.1093/jxb/ert208)
Figure 2 shows how we measure chlorophyll fluorescence using darkness, actinic light (used in photochemistry), and saturating light pulses.
At night and in the darkness, there is no non-photochemical quenching /heat loss; when a low-intensity measuring light strikes the leaves, the chlorophyll is excited, but there isn’t enough electron transport, so a minimum fluorescence (Fo) is recorded. A brief saturating pulse of light produces maximum fluorescence (Fm). The difference between Fo and Fm is Fv or variable fluorescence. Fo′ is the light equivalent of Fo and is measured after actinic light is switched off.
Fv/Fm is used to calculate the quantum yield of PS II chemistry or maximum photosynthesis and is usually ~0.83. Stress that affects the photosynthetic apparatus lowers this value.
When actinic light is applied, there is high fluorescence, followed by quenching by photochemical (photosynthesis) and non-photochemical (heat) events to reach a steady-state F′ in around twenty minutes. A saturating pulse administered during this time gives Fm′ or maximum fluorescence in the light phase. However, this is usually less than Fm as light is also lost as heat.
The operating efficiency of PS II photochemistry (or light used in photochemistry) is recorded in the light phase and does not require a dark phase measurement. It is calculated as Fq′/Fm′, where Fq′ is the difference between Fm′ and F′. These changes were first identified by Kautsky et al. in 1960 and named the Kautsky effect. Table 1 shows a brief list of parameters and the equations to determine them based on the Kautsky effect.
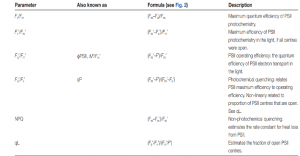
Table 1. “List of commonly used abbreviations and equations,” Murchie & Lawson (2013). (Credits: DOI:10.1093/jxb/ert208)
Factors Affecting Chlorophyll Fluorescence
The intrinsic factors that affect chlorophyll fluorescence are many and are closely related to environmental changes.
Intrinsic Factors
Stomatal opening: When stomata open and let in carbon dioxide, there are more sinks for the electrons so that fluorescence will decrease. So all external conditions that close stomata will increase fluorescence.
Abscisic acid (ABA): The production of this hormone will close stomata and increase fluorescence.
Biochemical processes: An increase in the oxygenase activity of RuBisCO, due to water deficit in leaves, will result in less carbon fixation or photosynthesis. Therefore chlorophyll fluorescence will increase.
Photosynthesis process: Any factor that reduces photosynthesis will increase fluorescence.
Genetics: Cultivars with improved photosynthesis will affect fluorescence.
Photorespiration: Since carbon dioxide will act as sinks for electrons, photorespiration that produces carbon dioxide will reduce chlorophyll fluorescence. This effect occurs in C3 plants, not C4 plants, where photorespiration is controlled.
External factors that affect chlorophyll fluorescence
Air humidity: Higher humidity that closes stomata to control transpiration will increase chlorophyll fluorescence.
Light: During the night, there is no fluorescence in the absence of the light-dependent phases of photosynthesis.
Shading: Tree canopy or any neighborhood effects that cause shading will influence incoming light and change fluorescence.
Temperature: Temperature changes affect relative oxygenation rates and carboxylation and change fluorescence levels.
Drought or low soil moisture: When stomata close and photosynthesis decreases during drought, chlorophyll fluorescence will increase.
Pest and diseases: Any factors that disrupt electron transfer will affect chlorophyll fluorescence.
Abiotic stress: When abiotic stress increases the activity of alternative electron sinks, for example, through the Mehler reaction and cyclic electron transport, chlorophyll fluorescence will decrease.
Importance and Relevance of Fluorescence
Chlorophyll fluorescence can evaluate changes in PSII photochemistry linear electron flux, and CO2 assimilation. These processes can shed light on plant responses to their environment, ecological diversity, and genetic variation.
Measuring Photosynthetic Rate
Since changes in chlorophyll fluorescence are associated with PS II photochemistry, it estimates the photosynthetic rate.
Estimating fluorescence is usually done with Infrared Gas Analysis or spectroscopy to measure changes in photosynthesis. The photosynthetic rate can be calculated at the leaf or plant level or across larger scales using imaging.
Stress Detection
Chlorophyll fluorescence occurs in the light range of 650 and 800 nanometres with two peaks corresponding to red (687 nm) and far-red (760 nm) wavelengths.
Red fluorescence (F687) occurs in PS II, and far-red (F760) in PS I. Therefore, the ratio of red to far-red fluorescence (F687/F760) is used to estimate environmental stress.
When leaves are damaged due to drought, pests, or diseases, more red light is emitted by leaves, and the value of the ratio increases. This ratio is widely used in crop and forest sciences research to detect and evaluate abiotic stress of various kinds, such as temperature extremes, ozone, heavy metal pollution, nutrient deficiency, UV radiation, light intensity, salinity, etc. See Figure 3.
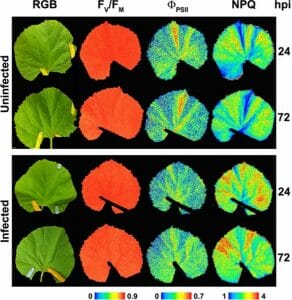
Figure 3: “Representative images of the symptomatology (color reflectance pictures, RGB), PSII efficiency (FV/FM and ΦPSII) as well as non-photochemical quenching (NPQ) from non-infected and Podosphaera xanthii–infected melon leaves at 24 and 72 hours post-infection (hpi),” Modified from Polonio et al. (2019) (http://creativecommons.org/licenses/by/4.0/). (Image credits: Perez-Bruno et al. 2019. https://www.frontiersin.org/articles/10.3389/fpls.2019.01135/full)
Sun-Induced Fluorescence
Sun-induced fluorescence is the chlorophyll fluorescence of sunlight. Sun-induced chlorophyll fluorescence is estimated by imaging, through satellites or proximal remote sensing, and is ideal for fields and regional estimations.
Imaging is used to map chlorophyll fluorescence of agricultural and horticultural fields in precision farming. Combined with computer technologies, machine learning, and modeling, it is one of the techniques used to estimate photosynthetic rates to judge crop growth and productivity and detect the extent and intensity of abiotic and biotic stress. In addition, these estimations are used to make variable rate applications of irrigation, fertilizers, and treatments.
Sun-induced fluorescence is also similarly used in precision forestry.
Light Use Efficiency
It is challenging to extrapolate photosynthetic rates from leaf to regional scale. Large-scale chlorophyll fluorescence measurements allow scientists to overcome this challenge by estimating light use efficiency over larger scales to calculate photosynthetic rate and thereby gross primary production of entire forests or other natural ecosystems.
Scientists have established a link between sun-induced fluorescence and gross primary productivity, so it is being used to estimate biomass and the productivity of forests. Fluorescence is thus used to estimate carbon flux in natural ecosystems and forests more efficiently than ever before.
Specific Applications
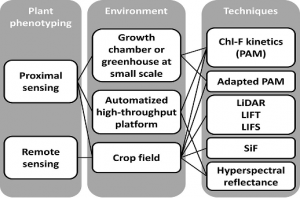
Figure 4: “Different approaches based on chlorophyll fluorescence imaging systems to plant phenotyping. The scales of analysis include: lab-scale, high-throughput platforms under controlled environmental conditions, and field-scale under natural environmental conditions. Techniques are grouped by the source of light used for the measurements: LEDs (PAM measurements), laser (LiDAR, LIFT, and LIFS), and natural light (SiF and hyperspectral reflectance on canopy surface),” Perez-Bruno et al. 2019. ( Image credits: Front. Plant Sci., 18 September 2019 | https://doi.org/10.3389/fpls.2019.01135)
Chlorophyll fluorescence measurements at small and large scales are used for a wide range of applications in agriculture, forestry, ecological studies, and climate change action, such as:
● Crop breeding to find drought-tolerant varieties
● Screening for desirable traits
● Estimating the photosynthetic efficiency of algae for energy production
● Screening for cultivars whose photosynthetic rate is adapted to extreme environments
● Monitoring ecotoxicological effects of heavy metal pollution in soil, air pollutants, and herbicides
● Plant phenotyping, using chlorophyll fluorescence as a reliable biomarker of photosynthetic apparatus level for screening crop plants. See Figure 4.
● Genetical studies to enhance stress tolerance or photosynthetic efficiency of crop plants
● Providing early and accurate insights in precision farming for irrigation, fertilization, pest, disease treatment, etc.
● Remote sensing-based carbon flux calculation
● In precision forestry to monitor productivity and stress
● Estimating aquatic plant productivity
● Biomass estimation in forestry
Measuring Chlorophyll Fluorescence
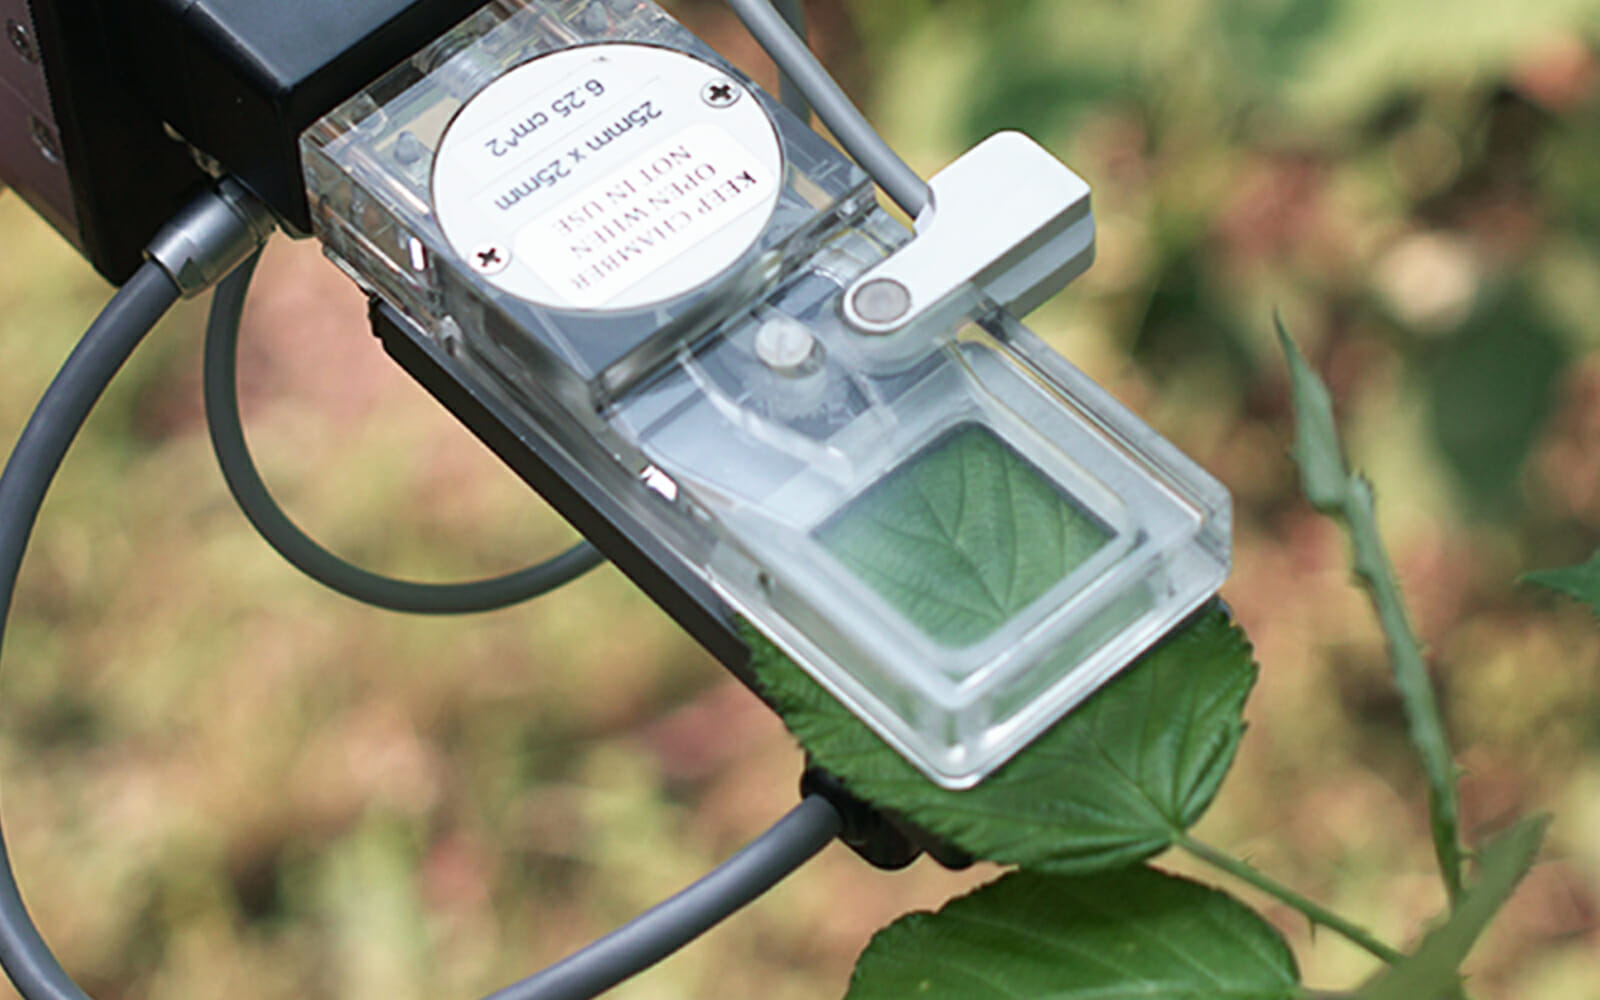
There are small hand-held tools, such as the CI-510CF Chlorophyll Fluorescence Module, which can be used with the CI-340 Handheld Photosynthesis System to provide simultaneous estimations of fluorescence with photosynthesis, and other related physiological processes like stomatal conductance. The tool manufactured by CID Bio-Science inc. gives precise results within seconds and is ideal for laboratory, greenhouse, and field estimations research. Since there are ten different-sized leaf chambers, a wide range of species can be measured. Chlorophyll fluorescence is a non-invasive measurement that is an easy and cost-effective indicator of photosynthetic processes and plant responses to environmental change.
Sources
Baker N. R. (2008). Chlorophyll fluorescence: a probe of photosynthesis in vivo. Annual review of plant biology, 59, 89–113. https://doi.org/10.1146/annurev.arplant.59.032607.092759
Dąbrowski, P., Baczewska-Dąbrowska, A. H., Kalaji, H. M., Goltsev, V., Paunov, M., Rapacz, M., Wójcik-Jagła, M., Pawluśkiewicz, B., Bąba, W., & Brestic, M. (2019). Exploration of chlorophyll a fluorescence and plant gas exchange parameters as indicators of drought tolerance in perennial ryegrass. Sensors, 19(12), 2736. https://doi.org/10.3390/s19122736
Guidi L., & Degl’Innocenti E. (2012). Chlorophyll a Fluorescence in Abiotic Stress. In: Venkateswarlu B., Shanker A., Shanker C., Maheswari M. (eds) Crop Stress and its Management: Perspectives and Strategies. Springer, Dordrecht. https://doi.org/10.1007/978-94-007-2220-0_10
Haworth, M.R., Marino, G., & Centritto, M. (2018). An introductory guide to gas exchange analysis of photosynthesis and its application to plant phenotyping and precision irrigation to enhance water use efficiency. Journal of Water and Climate Change.
Kalaji, H.M., Schansker, G., Brestic, M. et al. (2017).Frequently asked questions about chlorophyll fluorescence, the sequel. Photosynth Res 132, 13–66. https://doi.org/10.1007/s11120-016-0318-y
Kalaji, H. M., Rastogi, A., Živčák, M., et al. (2018). Prompt chlorophyll fluorescence as a tool for crop phenotyping: An example of barley landraces exposed to various abiotic stress factors. Photosynthetica, 56(3), 953–961. https://doi.org/10.1007/s11099-018-0766-z
Maxwell, K., & Johnson, G. N. (200). Chlorophyll fluorescence—a practical guide, Journal of Experimental Botany, 51(345), 659–668. https://doi.org/10.1093/jexbot/51.345.659
Misra, A., Misra, M., & Singh, R. (2012) Chlorophyll fluorescence in plant biology. In A.N.Misra (eds) Biophysics Chapter: 7, InTech. (pp.171-192). DOI:10.5772/35111
Moustakas, M., Calatayud, Á., & Guidi, L. (2021). Editorial: Chlorophyll fluorescence imaging analysis in biotic and abiotic stress. Frontiers in Plant Science, 12. https://doi.org/10.3389/fpls.2021.658500
Murchie, E.H., & Lawson, T. (2013). Chlorophyll fluorescence analysis: a guide to good practice and understanding some new applications. Journal of experimental botany, 64 13, 3983-98.
Pérez-Bueno, M. L., Pineda, M., & Barón, M. (2019). Phenotyping plant responses to biotic stress by chlorophyll fluorescence imaging. Frontiers in Plant Science, 10. https://doi.org/10.3389/fpls.2019.01135
Popovic, R., Dewez, D., & Juneau, P. (2003). Applications of Chlorophyll Fluorescence in Ecotoxicology: Heavy Metals, Herbicides, and Air Pollutants. In Practical Applications of Chlorophyll Fluorescence in Plant Biology, (pp.151-184). DOI:10.1007/978-1-4615-0415-3_5
Most Popular Articles
- Transpiration in Plants: Its Importance and Applications
- Leaf Area – How & Why Measuring Leaf Area…
- How to Analyze Photosynthesis in Plants: Methods and Tools
- Plant Respiration: Its Importance and Applications
- The Forest Canopy: Structure, Roles & Measurement
- Stomatal Conductance: Functions, Measurement, and…
- Forest & Plant Canopy Analysis – Tools…
- Root Respiration: Importance and Applications
- 50 Best Universities for Plant Science
- The Importance of Leaf Area Index (LAI) in…