5 Signs Your Instrument Is Giving Bad Data (and how to fix it)
Scott Trimble
June 18, 2026 at 5:14 pm | Updated June 18, 2026 at 5:14 pm | 5 min read
Bad data in plant research can quietly derail months of work. You can follow a solid protocol, control treatments carefully, and still end up with results that do not make sense. When that happens, the issue is often not your experimental design. It is the instrument.
Whether you are measuring gas exchange, leaf area, canopy structure, root growth, or spectral reflectance, your tools need to be stable, calibrated, and appropriate for the job. Below are five clear signs your instrument is producing bad data in plant research, along with practical steps to fix the problem. We will also look at how purpose-built systems from CID Bio-Science help prevent these issues in the first place.
1. Your Measurements Drift Over Time
One of the most common red flags is data drift. You measure the same sample twice under identical conditions and get different results. Over hours or days, baseline values slowly shift.
Subscribe to receive our monthly round-up of articles.
In gas exchange work, this might show up as unstable CO2 or H2O readings. With leaf area meters, you might see small but consistent increases or decreases in measured area for the same calibration object. In spectral measurements, reflectance curves may subtly shift even though the leaf has not changed.
Drift is a classic source of bad data in plant research because it is gradual. It does not always trigger immediate suspicion.
How to fix it:
-
Check for sensor contamination or aging components
-
Confirm stable power supply and battery health
-
Review calibration status and procedures
-
Inspect tubing, seals, and chambers for leaks
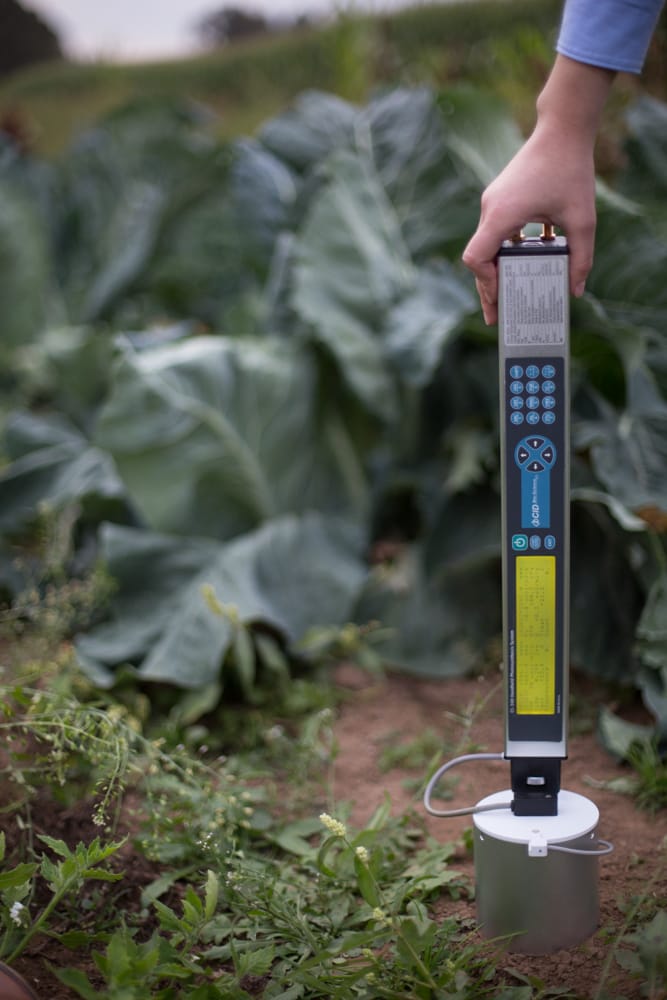
For example, the CI-340 Handheld Photosynthesis System reduces measurement delay by directly connecting the chamber to the CO2 and H2O gas analyzer . Stable analyzers and modular environmental control reduce the risk of subtle drift during gas exchange measurements. If you suspect drift, running a controlled test with known reference conditions can quickly reveal instability.
2. Your Data Has Unexplained Variability
Natural biological variability is expected. Instrument-driven variability is not.
If replicate measurements from the same leaf or canopy show excessive spread, and you have ruled out biological causes, your instrument may be introducing noise. This is another pathway to bad data in plant research.
Common causes include:
-
Inconsistent positioning of the sample
-
Poor chamber sealing
-
Variable lighting during canopy or spectral measurements
-
Mechanical instability in scanning systems
For leaf area work, consistency is critical. The CI-202 Portable Laser Leaf Area Meter offers 0.01 cm2 resolution and does not require user calibration . It flattens curled leaves to ensure precise measurement geometry. That design reduces operator-induced variability, which is a frequent hidden source of error in competitive systems that rely on manual flattening or image thresholding.
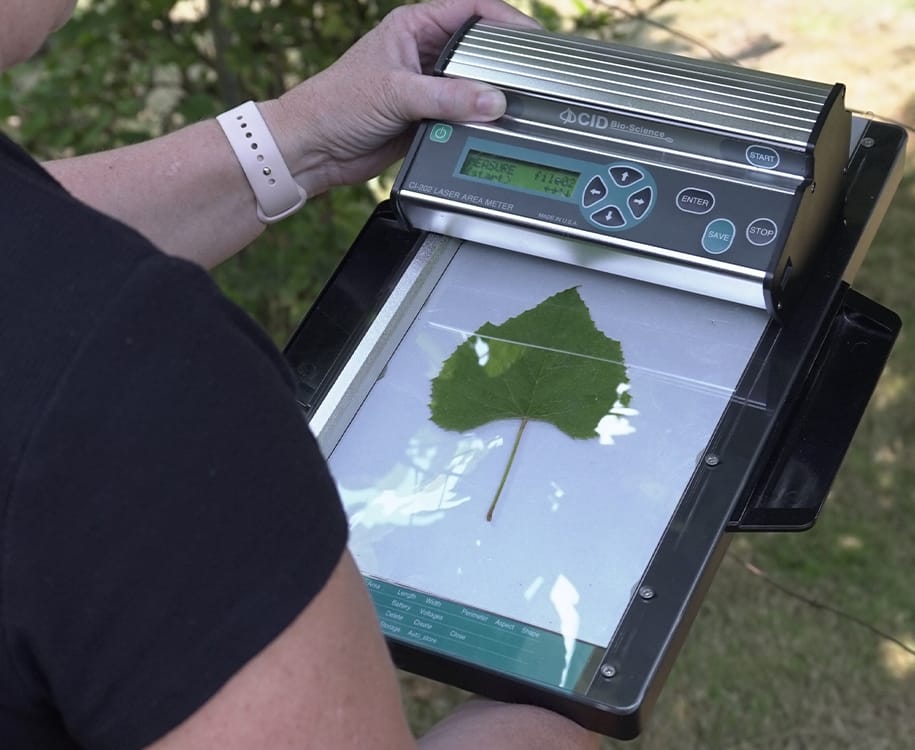
Similarly, the CI-203 Handheld Laser Leaf Area Meter provides a graphic display of the scanned leaf outline for immediate verification . If your outline looks wrong, you know instantly. That visual confirmation step is one of the simplest ways to prevent bad data in plant research before it enters your dataset.
If you see unexplained variability, standardize your measurement posture, verify instrument alignment, and use built-in visual or digital verification tools whenever possible.
3. Your Results Conflict with Basic Physiology
When your data contradicts well-established plant responses, take a pause.
If photosynthesis increases in complete darkness or chlorophyll indices spike in visibly senescing leaves, the issue may not be the plant. It may be your measurement setup.
In canopy analysis, inconsistent sky conditions or improper thresholding can distort leaf area index estimates. The CI-110 Plant Canopy Imager addresses this by combining hemispherical imaging with 24 PAR sensors and enabling measurements under any sky condition. It also includes literature-based thresholding methods such as Otsu and entropy crossover. That reduces operator subjectivity, which is often responsible for bad data in plant research involving image segmentation.
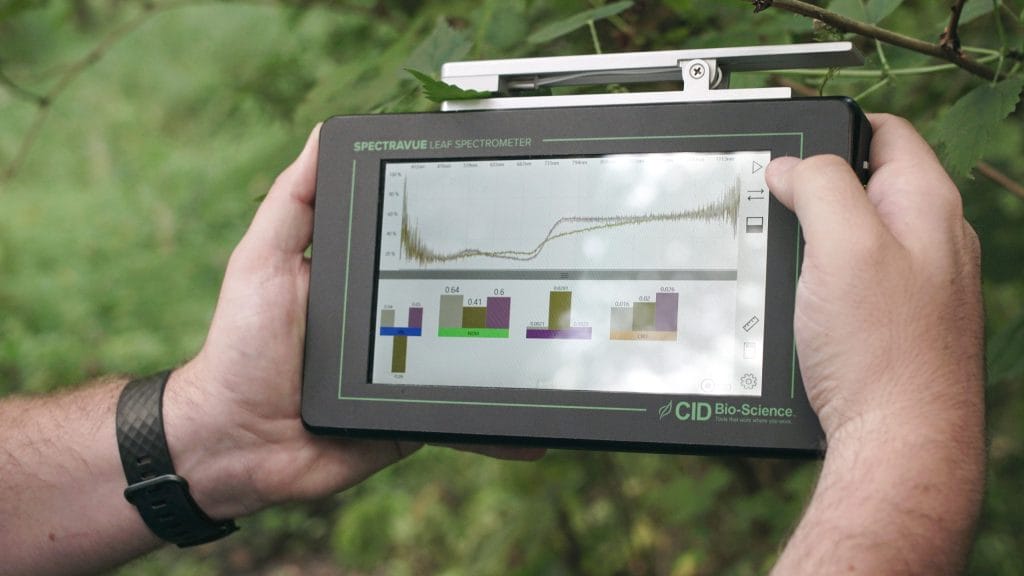
In spectroscopy, limited wavelength range or high stray light can distort pigment indices. The CI-710s SpectraVue Leaf Spectrometer covers 360 to 1100 nm and measures reflectance, transmittance, and absorbance simultaneously. A wide spectral range and strong signal-to-noise performance reduce the risk of drawing conclusions from incomplete or distorted spectra.
If your results contradict plant physiology, check:
-
Environmental controls during measurement
-
Sensor saturation or clipping
-
Proper wavelength or PAR calibration
-
Whether your instrument is designed for your specific tissue type
Often, the fix is not adjusting the data. It is improving the measurement environment or upgrading to a system designed for plant-specific work.
4. Your Instrument Cannot Replicate Published Methods
Another sign of bad data in plant research is methodological incompatibility. If you cannot replicate chamber conditions, spectral ranges, or measurement geometries described in peer-reviewed studies, your comparisons will be flawed.
For example, gas exchange studies often require control over CO2 concentration, temperature, humidity, and light intensity. The CI-340 supports modular control of CO2, H2O, temperature, and light, and even simultaneous chlorophyll fluorescence measurement. That flexibility allows researchers to match experimental conditions used in the literature.
In canopy studies, instruments that require above-canopy reference readings can introduce logistical challenges and inconsistencies. The CI-110 can calculate gap fraction LAI without above-canopy reference readings. That design simplifies replication of multi-site studies and reduces procedural error.
If your instrument limits your ability to match published protocols, you risk introducing systematic bias. The fix may involve upgrading to a platform that was designed specifically for plant science rather than adapted from another industry.
5. Your Workflow Encourages Shortcuts
Sometimes bad data in plant research is not about hardware limitations. It is about friction.
If downloading data is cumbersome, if storage is limited, or if calibration is complicated, users tend to cut corners. They measure fewer replicates. They skip verification steps. They delay maintenance.
Modern instruments should remove those barriers. The CI-203 offers SD card storage with virtually unlimited capacity and GPS tagging for each measurement . The CI-202 stores up to 8,000 measurements internally. The CI-710s includes 64 GB of memory and onboard analysis software .
When your instrument supports efficient workflows, you are less likely to compromise data integrity. Good design directly reduces the risk of bad data in plant research.
If you find yourself avoiding certain measurements because the process is tedious, that is a warning sign. Reliable research depends on repeatability, and repeatability depends on practical, field-ready systems.
A Practical Checklist to Protect Your Data
To minimize bad data in plant research, build these habits into your workflow:
-
Run periodic reference or control measurements
-
Inspect physical components regularly
-
Standardize operator technique across team members
-
Use instruments with built-in verification tools
-
Choose plant-specific systems with appropriate environmental controls
CID Bio-Science instruments are designed around real research conditions. They are lightweight, field-ready, and built to reduce user calibration and subjective interpretation. From laser-based leaf area measurement to modular gas exchange and advanced spectroscopy, the goal is straightforward: help you trust your data.
Ready to Improve Your Measurement Confidence?
If you are concerned about bad data in plant research, it may be time to evaluate your instrumentation. Visit www.cid-inc.com to explore the full line of plant science tools, review application notes, and connect with the CID Bio-Science team. Investing in stable, purpose-built systems now can save months of uncertainty later.
Accurate data drives strong conclusions. The right instrument makes that possible.
Related Products
Most Popular Articles
- Transpiration in Plants: Its Importance and Applications
- Leaf Area – How & Why Measuring Leaf Area…
- How to Analyze Photosynthesis in Plants: Methods and Tools
- Plant Respiration: Its Importance and Applications
- The Forest Canopy: Structure, Roles & Measurement
- Stomatal Conductance: Functions, Measurement, and…
- Forest & Plant Canopy Analysis – Tools…
- Root Respiration: Importance and Applications
- 50 Best Universities for Plant Science
- The Importance of Leaf Area Index (LAI) in…