How Transpiration and Evaporation Shape Global Trends in Evapotranspiration
Dr. Vijayalaxmi Kinhal
March 26, 2026 at 9:08 pm | Updated April 14, 2026 at 2:51 am | 7 min read
- Evapotranspiration around the world can vary across biomes, and each biome experiences interannual variations.
- Transpiration contributes more to evapotranspiration in tropical humid regions, and soil evaporation is more prominent in arid and semiarid sparsely vegetated regions.
- Anthropogenic interventions, such as land-use change and irrigation, can alter evapotranspiration, transpiration, and soil evaporation.
Evapotranspiration is a vital component of the global water and energy cycle. Understanding how the contributions of its two main constituents, transpiration and evaporation, vary across ecosystems can inform land and resource management. This article presents results from modelling and empirical data for the three relevant plant physiological processes.
Evapotranspiration
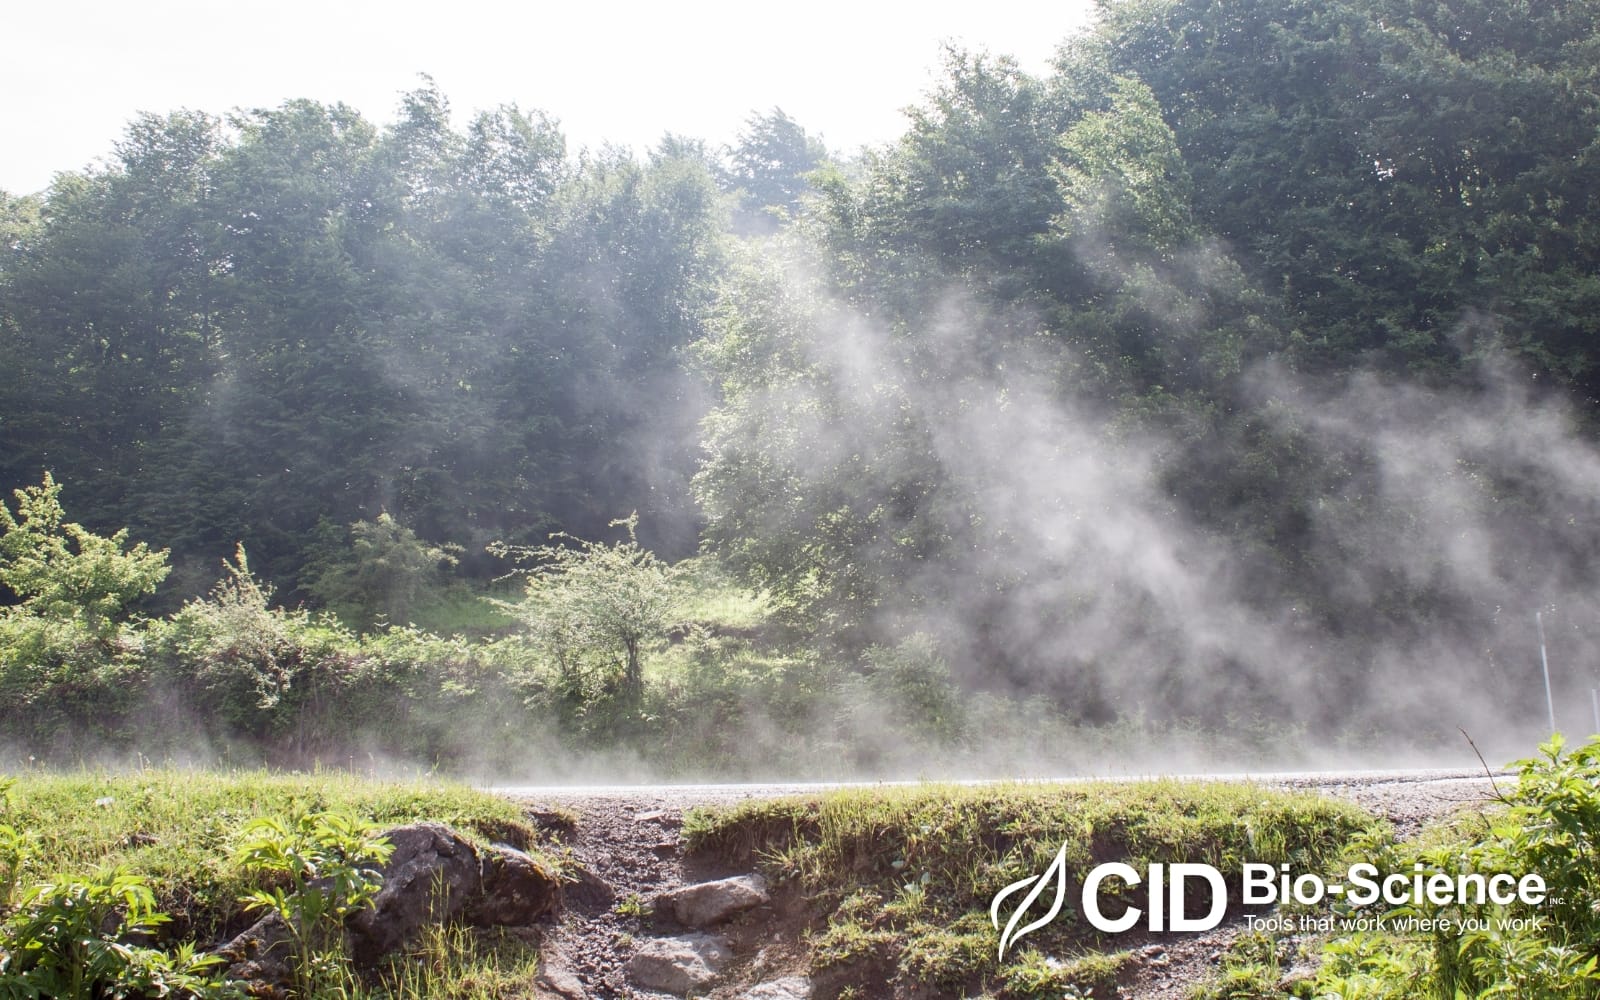
Evapotranspiration (ET) is the total of transpiration, soil evaporation, open water evaporation, and evaporation of canopy intercepted water. Of these, the main contributors are transpiration and soil evaporation.
Evapotranspiration is the process that connects global water and energy cycles. ET absorbs 50% of the available radiation and returns over 60% of the rainfall. It is the process by which water from the soil is transferred to the atmosphere. ET is a key driver of water inputs into the precipitation cycle and of groundwater recharge. For example, 18-25% of rainfall in La Plata originates from Amazon Basin ET, and 9-10% of rainfall across South America originates from regional ET.
Subscribe to receive our monthly round-up of articles.
ET can also influence soil temperature. All its effects together can influence ecosystem health and climate.
Therefore, it is useful to understand ET trends globally and how transpiration and soil evaporation shape them. Moreover, examining the factors influencing evaporation (E) and transpiration (T) can inform us of how plant physiological processes shape the global water cycle.
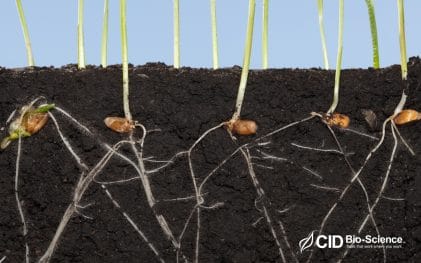
Transpiration directly links the water cycle to vegetation growth as stomatal conductance is also connected to carbon dioxide fixation through photosynthesis. Soil evaporation provides an indirect link between vegetation and hydrological cycles, as plant cover and associated changes influence air-soil interactions.
Several factors can affect ET, as listed below:
- Energy availability: More heat energy results in more ET.
- Humidity gradient: The moisture gradient between soil and air is a major factor. Drier air results in more ET.
- Water availability: Soil water availability is necessary for ET.
- Soil characteristics: Soil chemistry, heat capacity, and albedo affect ET.
- Wind: Wind can move water vapor or water over soil surfaces. Moreover, wind also transfers heat energy. So, higher wind speed increases ET.
- Vegetation form: Plant parameters such as cover, height, leaf area index, leaf shape, and plant reflectivity will influence ET. For example, coniferous forests reflect less solar energy, increasing transpiration, whereas deserts reflect more solar energy.
- Plant processes: Several processes, such as photosynthesis and stomatal conductance, also affect ET.
- Land use changes: Changes in vegetation and land cover will alter ET.
- Management practices: Agricultural practices in croplands, especially water treatments, can influence ET.
These factors also influence transpiration and soil evaporation, and their contribution to ET.
The factors have been used in various studies at individual in situ sites and in model-based calculations to find how ET varies in different ecosystems.
Global Evapotranspiration Trends
Due to the many factors that determine ET, it varies significantly across different ecosystems. Around 90 datasets exist to determine ET.
A study by Cia et al. (2024) compared the 90 ET datasets across six model categories: machine learning (ML), reanalysis, remote sensing (RS), Coupled Model Intercomparison Project (CMIP6), Land Surface Model (LSMs), and Ensembles, and found a consensus on global ET trends emerging from the data. The scientists wanted to understand ET and changes over space and time (1980-2014) in 11 biomes: evergreen needleleaf forests, evergreen broadleaf forests, deciduous broadleaf forests, closed shrublands, open shrublands, woody savannas, savannas, grasslands, permanent wetlands, croplands, and barren sparse vegetation.
![]()
Figure 1: “Spatial distribution of annual mean values of 6 ET categories- machine learning (ML), reanalysis, remote sensing (RS), Coupled Model Intercomparison Project (CMIP6), Land Surface Model (LSMs), and Ensembled,” Cia et al. (2024). (Image credits: https://agupubs.onlinelibrary.wiley.com/doi/full/10.1029/2024WR037608
The comparison found that annual ET means are consistent across the six categories; also see Figure 1.
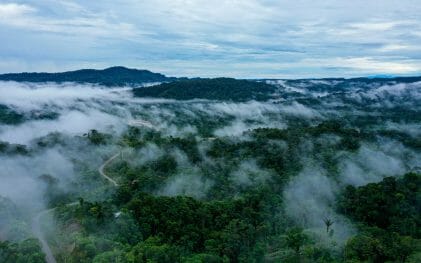
- The highest ET is found in the densely vegetated tropical regions (>1,200 mm/yr) between 20°N and 20°S, including the Congo Basin, the Amazon Basin, and the Southeast Asian Islands, where evergreen broadleaf forests occur. The main drivers are high rainfall and radiation.
- High ET is found in humid subtropics, including North America, part of South America, Southeast Asia, and Oceania.
- Wetlands have a moderate ET of 609.3 mm/yr.
- Shrublands and grasslands have a low ET of 235–545 mm/yr.
- The lowest ET, below 400 mm/yr, is observed in arid and semi-arid regions.
- Negative ET, i.e., water vapor deposition on the ground (e.g., dew), occurs in the Sahara Desert, parts of Central Asia, and the Arabian Peninsula. These areas are tropical, subtropical, and temperate deserts. However, negative ET also indicates that ET estimates are inaccurate in very dry environments.
Factors Affecting Evapotranspiration Global Distribution
The main factors affecting ET are precipitation, shortwave radiation (SW), vapor pressure deficit (VPD), and leaf area index (LAI). However, various regions are driven by different factors:
- Precipitation-limited ET is in arid regions such as Southwest Asia, Australia, and South Africa.
- Radiation was correlated with ET trends at high altitudes, as they have energy limitations.
- VPD was very strongly correlated with ET in most biomes: tropical, temperate, boreal, and polar. In contrast, ET increased as VPD reduced in drylands.
- LAI was very strongly correlated with ET in all biomes.
ET was high in areas with high precipitation and low VPD.
A Penman-Monteith-Leuning (PML) model-based study by Zhang et al. (2017) found that interannual variation in ET was the highest in tropics and sub-tropics- tropical Amazonia, Sahel, western South America, southwestern North America, South Africa, northern Australia, India, and southeastern Asia. The interannual variations were low elsewhere in the world, as shown in Figure 2(a).
![]()
Figure 2: “Spatial pattern of variance of estimated actual evapotranspiration (Var(ETa)), plant transpiration (Var(T)) and soil evaporation (Var(E)), and their covariance (2Cov(E, T)) across global land surface,” Zhang et al. (2017). (Image credits: https://agupubs.onlinelibrary.wiley.com/doi/pdf/10.1002/2017JD027025)
Partitioning Evapotranspiration
The contributions of transpiration and soil evaporation to variations in ET are less well understood. The few global studies that explore the connections use a process-based model that accounts for the major factors that influence T and E.
Zhang et al. (2017) used the PML model, which includes drivers of water, energy, and vegetation dynamics, to also study the contributions of E and T to variations in ET; see Figure 2.
E Contribution: Soil evaporation is the dominant contributor to ET in extremely dry climates, such as the Sahara and Gobi deserts, Australia, and South Africa, where vegetation is sparse. The E has two peaks, one between 25°N and 42°N and the other between 13°S and 27°S. The regions between 13°S and 27°S, with Australia, contribute to 17.9% of ET global variations, even though it has only 10.5% of the global landmass.
The E also explains interannual variations in these regions. In dry biomes, as in the northern and southern midlatitudes, soil evaporation is driven by a lack of precipitation and is positively correlated with it. ET is negatively correlated with radiation in these regions. The hydrological link connecting vegetation to the water cycle is weak.
T contribution: Transpiration accounts for most of ET in extremely wet climates, such as humid tropical forests with a high LAI. T peaks in the tropics between 8°N and 13°S. T in these regions is driven by radiative energy or potential evapotranspiration. Potential evapotranspiration (ETp) is the maximum amount of water that can evaporate or transpire if enough water is available in an area and is calculated using the Penman-Monteith equation. Precipitation plays only a small role. So, the ecohydrological link between vegetation, water, and the energy cycle is strong.
Most global areas have less water and lower LAI, and E and T.
Anthropogenic Effects
Anthropogenic activities also influence variations in E and T. In arid and semi-arid areas, groundwater is used for irrigation in India, Pakistan, Bangladesh, the North China Plain, and the High Plains in the USA. As a result, LAI increases, so contrary to natural ecosystems in these regions, the contribution of T increases, and that of E decreases in these areas.
Land-use changes that alter vegetation cover will also affect ET, E, and T. Converting Amazon forests to pastures and croplands reduces the normally high ET because only one crop is grown per year. In the dry season, both ET and E fall. Managed landscapes alter the amount and seasonality of water flux, usually sharply reducing them. There is also a stronger correlation with LAI, driven by irrigation during the cropping period. Whereas if the cropland is rainfed, ET, E, and T values are similar to those of the area’s natural ecosystems.
Measuring Evapotranspiration and Transpiration
The most commonly used model for calculating actual ET is the FAO Penman-Monteith equation, which uses climatological data (sunshine, temperature, soil heat flux, humidity, and wind speed) without measuring specific vegetation or crop parameters.
However, field measurements of LAI and transpiration are also useful for obtaining in situ data to support the development and validation of ET and partitioning models. CID BioScience Inc offers tools for both purposes. The CI-110 Plant Canopy Imager can be used to measure LAI, and the CI-340 Handheld Photosynthesis System can be used to measure transpiration and stomatal conductance.
Contact CID BioScience Inc for more information on these two precision plant science tools for your research.
Sources
Cai, Y., Xu, Q., Bai, F., Cao, X., Wei, Z., Lu, X., … & Dai, Y. (2024). Reconciling global terrestrial evapotranspiration estimates from multi‐product intercomparison and evaluation. Water Resources Research, 60(9), e2024WR037608.
D’Acunha, B., Dalmagro, H. J., De Arruda, P. Z., Biudes, M. S., Lathuillière, M. J., Uribe, M., … & Johnson, M. S. (2024). Changes in evapotranspiration, transpiration and evaporation across natural and managed landscapes in the Amazon, Cerrado and Pantanal biomes. Agricultural and Forest Meteorology, 346, 109875.
Li, X., Gentine, P., Lin, C., Zhou, S., Sun, Z., Zheng, Y., … & Zheng, C. (2019). A simple and objective method to partition evapotranspiration into transpiration and evaporation at eddy-covariance sites. Agricultural and Forest Meteorology, 265, 171-182.
Southampton Weather. (n.d.). What on Earth is Evapotranspiration? Retrieved from https://www.southamptonweather.co.uk/evapotranspirationinline.php
Zhang, Y., Chiew, F. H., Peña‐Arancibia, J., Sun, F., Li, H., & Leuning, R. (2017). Global variation of transpiration and soil evaporation and the role of their major climate drivers. Journal of Geophysical Research: Atmospheres, 122(13), 6868-6881.
Zhang, K., Chen, H., Ma, N. et al. A global dataset of terrestrial evapotranspiration and soil moisture dynamics from 1982 to 2020. Sci Data 11, 445 (2024). https://doi.org/10.1038/s41597-024-03271-7
Related Products
Most Popular Articles
- Transpiration in Plants: Its Importance and Applications
- Leaf Area – How & Why Measuring Leaf Area…
- How to Analyze Photosynthesis in Plants: Methods and Tools
- Plant Respiration: Its Importance and Applications
- The Forest Canopy: Structure, Roles & Measurement
- Stomatal Conductance: Functions, Measurement, and…
- Forest & Plant Canopy Analysis – Tools…
- Root Respiration: Importance and Applications
- 50 Best Universities for Plant Science
- The Importance of Leaf Area Index (LAI) in…