What Happens If My Canopy Profiles Change Mid‑Season?

Scott Trimble
April 9, 2026 at 6:46 pm | Updated April 9, 2026 at 6:46 pm | 5 min read
Canopy profiles rarely stay still for an entire growing season. That is exactly why tracking canopy profiles matters. A crop can look uniform in early vegetative growth, then shift quickly once row closure, heat stress, nutrient differences, pruning, lodging, disease pressure, or irrigation variation start changing leaf angle, canopy density, and light penetration.
When canopy profiles move mid-season, your measurements need to capture real structural change instead of smoothing it away.
This is where a dedicated canopy workflow built around the CI-110 Plant Canopy Imager becomes especially useful, because it lets researchers and crop managers document changes in Leaf Area Index, gap fraction, PAR distribution, and canopy architecture directly in the field with immediate analysis.
Subscribe to receive our monthly round-up of articles.
Why mid-season canopy shifts matter?
A changing canopy profile is not just a visual observation. It usually signals a measurable change in how the crop intercepts light and distributes energy through the stand. As leaves expand, reposition, senesce, or thin out, the canopy starts behaving differently. That affects:
-
Light interception
-
Photosynthetically Active Radiation within the canopy
-
Gap fraction and sunflecks
-
Leaf Area Index
-
Microclimate around leaves
-
Photosynthetic performance at different canopy levels
In practical terms, that means your early-season assumptions may stop matching the actual field conditions.
A treatment that looked promising in June may create excessive self-shading in July. A block that appeared uniform may develop uneven light penetration after weather stress or differential fertility.
Mid-season canopy profiles can reveal those transitions before yield or quality losses become obvious. The CI-110 is designed for exactly this type of repeated, non-destructive canopy analysis, combining hemispherical imaging with PAR measurement in one portable system.
What usually causes canopy profiles to change?
Most mid-season canopy changes come from a handful of predictable sources:
-
Rapid leaf expansion during peak vegetative growth
-
Heat or drought stress that alters leaf angle and canopy openness
-
Nutrient differences that change vigor and leaf area development
-
Disease or pest pressure that reduces canopy density
-
Pruning, thinning, or management interventions
-
Cultivar or genotype differences that become more obvious later in the season
-
Lodging or storm damage that changes canopy structure
The important point is that the crop rarely changes in just one way. Canopy density, vertical layering, and light distribution often shift together. That is why using a tool that can estimate LAI and measure PAR at the same time is valuable.
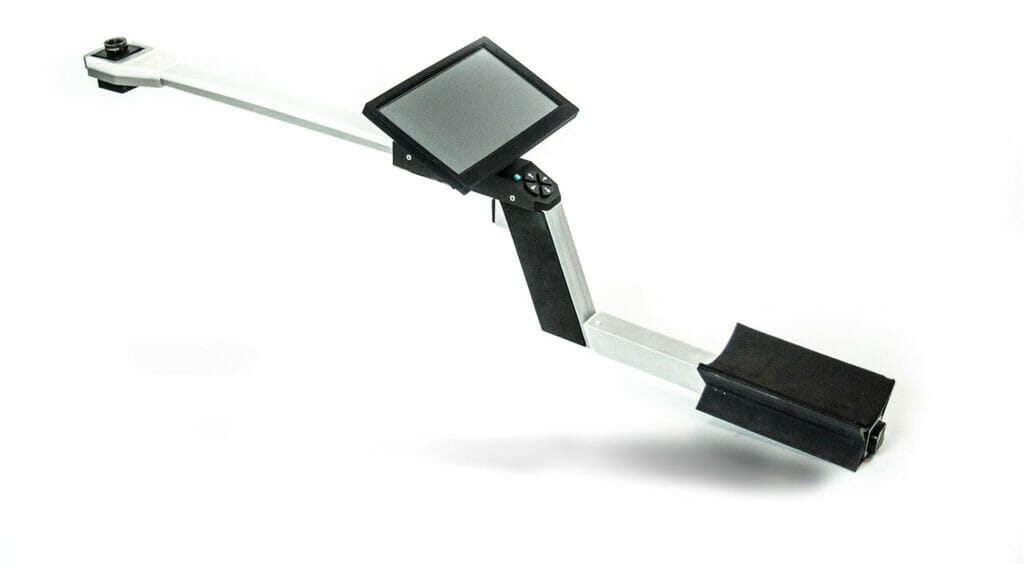
The CI-110 captures a 150° canopy image, measures PAR with 24 photodiodes, and performs in-field analysis without forcing you into a destructive sampling routine.
What should you measure when canopy profiles change?
When canopy profiles shift mid-season, it helps to focus on a few core metrics instead of trying to measure everything at once.
1. Leaf Area Index
LAI remains one of the fastest ways to quantify whether the canopy is thickening, thinning, or redistributing foliage. The CI-110 calculates LAI non-destructively using hemispherical images or PAR sensor data, which gives researchers flexibility across crop types and field conditions.
Unlike workflows that depend heavily on destructive harvests or separate post-processing steps, this approach supports repeated measurements in the same plots over time.
2. Gap fraction and sunflecks
If two canopies have similar LAI but different architecture, gap fraction can explain why the light environment still looks different.
Mid-season canopy profiles often change through redistribution, not just added biomass. The CI-110 can calculate canopy gap fraction distribution and evaluate sunflecks through its PAR sensing arm, which helps reveal whether light is moving deeper into the canopy or being blocked at the top.
3. PAR distribution
A canopy profile is really a light management story. If PAR penetration drops too sharply, lower canopy leaves may become less productive. If the canopy opens up under stress, you may see more light deeper in the profile but less total interception. Because the CI-110 integrates PAR measurement directly into the instrument, you can track those changes during the same field pass.
Why repeated measurements matter more than one-time snapshots?
The biggest mistake in canopy work is treating the canopy as fixed. Mid-season canopy profiles are dynamic, so your measurement strategy should be dynamic too.
The CI-110 supports repeated measurements in the same location with internal compass and GPS tracking, which makes it easier to build a time-series view instead of isolated snapshots. That matters when you want to compare pre-stress and post-stress conditions, treatment responses, or structural differences between genotypes across the season.
This is also where CID Bio-Science has a practical advantage.
The platform is built for field use, with self-leveling image capture, onboard analysis, selectable thresholding methods, and operation under varying sky conditions. Instead of taking data home and hoping it still makes sense later, you can verify image quality, review results, and standardize repeat measurements while still in the field. For real canopy work, that saves time and reduces avoidable variability.
When should you pair canopy analysis with other measurements?
If canopy profiles are changing mid-season, canopy data alone may not tell the whole story. This is where CID’s broader instrument line becomes useful.
For example:
-
Use the CI-340 Handheld Photosynthesis System when you want to connect canopy structure to gas exchange, stomatal conductance, transpiration, internal CO2, or leaf temperature
-
Use the CI-202 or CI-203 leaf area meters when you need detailed leaf-level area and shape measurements to explain changes seen at the canopy scale
-
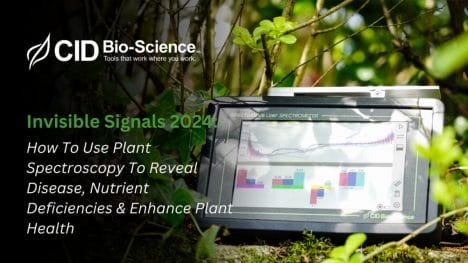
Use the CI-710s SpectraVue Leaf Spectrometer when canopy shifts may be tied to pigment changes, nutrient status, or stress signatures in leaf reflectance, transmittance, and absorbance.
That instrument-to-instrument continuity is a real strength. Instead of treating canopy, leaf area, physiology, and spectral response as separate workflows, CID Bio-Science makes it easier to connect them in one research program.
The CI-340 supports open or closed system measurements with interchangeable chambers and control modules, while the CI-202 and CI-203 provide non-destructive leaf measurement and the CI-710s adds field spectroscopy for stress and pigment analysis.
A practical way to respond to mid-season canopy changes
When canopy profiles start changing, a solid response looks like this:
-
Revisit the same plots on a regular schedule
-
Capture canopy images and PAR data using the same protocol each time
-
Compare LAI, gap fraction, and light penetration trends
-
Add leaf-level or gas exchange measurements where the canopy data suggests a functional shift
-
Use those combined measurements to separate temporary stress responses from structural canopy change
That approach gives you a more defensible interpretation of what the crop is doing and why.
Final Thoughts
If your canopy profiles change mid-season, that is not a measurement problem. It is the biological reality you need to document. The more responsive your canopy workflow is, the more value you get from those changes.
CID Bio-Science’s CI-110 Plant Canopy Imager is well suited to this kind of repeated field analysis because it combines canopy imaging, PAR measurement, onboard LAI analysis, and location tracking in one non-destructive platform built for real research conditions.
When you need to go deeper, CID’s connected line of leaf area, photosynthesis, and spectroscopy tools helps you move from canopy structure to plant function without forcing a fragmented workflow.
To see how CID Bio-Science can support your canopy analysis workflow, explore the CI-110 and the rest of the CID plant science instrument line at CID Bio-Science.
Related Products
Most Popular Articles
- Transpiration in Plants: Its Importance and Applications
- Leaf Area – How & Why Measuring Leaf Area…
- How to Analyze Photosynthesis in Plants: Methods and Tools
- Plant Respiration: Its Importance and Applications
- The Forest Canopy: Structure, Roles & Measurement
- Stomatal Conductance: Functions, Measurement, and…
- Forest & Plant Canopy Analysis – Tools…
- Root Respiration: Importance and Applications
- 50 Best Universities for Plant Science
- The Importance of Leaf Area Index (LAI) in…