Why Are My LAI Values Higher Than Expected and How Do I Check the Instrument?
Scott Trimble
April 9, 2026 at 6:38 pm | Updated April 9, 2026 at 6:38 pm | 6 min read
If your leaf area index readings seem too high, the first thing to know is that high leaf area index values are not always caused by a faulty instrument. In many cases, the issue comes from measurement setup, image conditions, thresholding choices, canopy structure, or how the instrument is being used in the field.
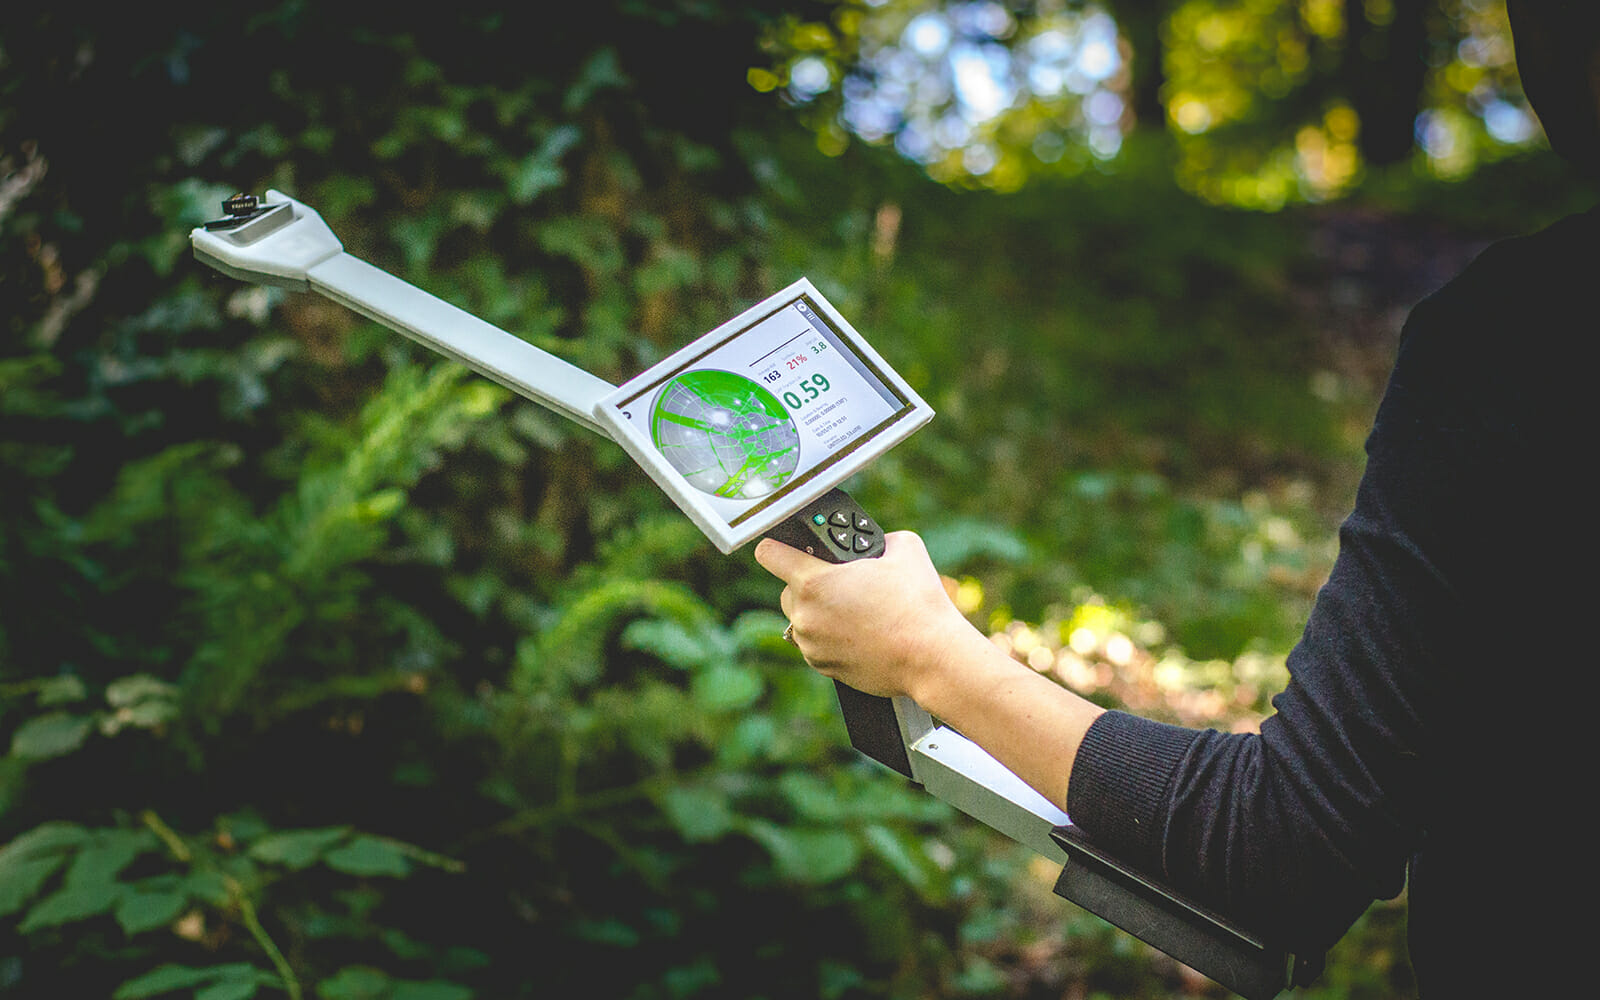
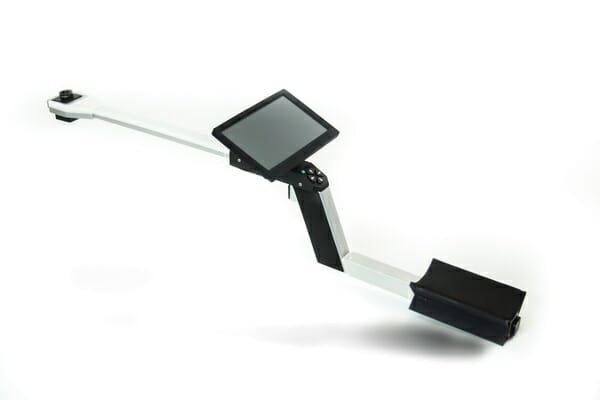
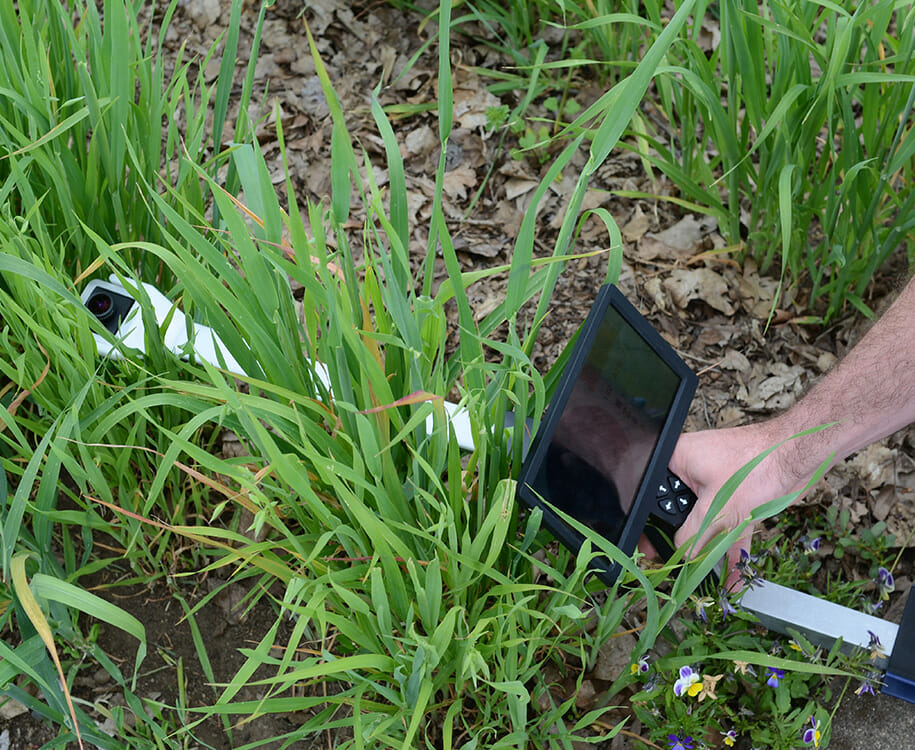
With the CI-110 Plant Canopy Imager, you are working with a system that combines hemispherical canopy photography, PAR sensing, and on-board analysis tools, so small setup errors can push results upward more than expected.
The good news is that most cases of unexpectedly high leaf area index readings can be tracked down with a structured instrument check and a review of field method.
Subscribe to the CID Bio-Science Weekly article series.
By submitting this form, you are consenting to receive marketing emails from: . You can revoke your consent to receive emails at any time by using the SafeUnsubscribe® link, found at the bottom of every email. Emails are serviced by Constant Contact
Start with the obvious question: is the value actually wrong?
Before assuming the instrument is off, compare the reading to the crop, stand, or canopy stage you are measuring. Dense canopies, overlapping layers, narrow gap fractions, and strong leaf clustering can all drive higher LAI. If you are measuring at peak biomass or in a closed canopy, a high result may be real.
That said, values that are consistently above expectations across multiple plots usually point to one of three things:
- image capture issues
- analysis settings issues
- inconsistent instrument setup
The CI-110 is designed to estimate leaf area index non-destructively using either hemispherical images or PAR sensors, and it can do this under a wide range of sky conditions. That flexibility is useful, but it also means users should check that the measurement mode and settings match the site conditions.
Common reasons leaf area index readings run high
1. The image threshold is classifying too much canopy
One of the most common causes of inflated leaf area index values is poor separation between sky and canopy in the captured image.
If bright leaves, haze, glare, or uneven light make canopy elements blend into the background, the software may underestimate open gaps. When gap fraction drops, LAI rises.
The CI-110 includes user-selectable thresholding methods such as Otsu and Entropy Crossover Technique, along with the ability to adjust RGB color values. That is useful, but it also means the wrong threshold choice can shift the result upward.
If your image looks acceptable by eye but the processed image classifies too many pixels as vegetation, your LAI can climb fast.
2. The wrong filter or poor light conditions are affecting the image
The CI-110 includes neutral density filters to optimize images across varying light conditions. If the filter choice does not match ambient conditions, the image may be overexposed or underexposed. Either case can affect canopy gap detection.
This matters most when working in direct sun, changing cloud cover, or highly reflective canopies. Even though the instrument is built to perform under any sky condition, image quality still depends on using the right filter and getting a clean canopy image.
3. The camera angle or leveling is off
The CI-110 uses a self-leveling digital camera with a 150° field of view. That helps standardize image geometry, but you still need to confirm the unit is being positioned consistently and that the operator is not introducing tilt during handling or trigger use.
A non-standard view of the canopy can change the gap fraction distribution and push the leaf area index result higher than expected.
4. You are measuring too close to stems, trunks, or dense local obstructions
A technically correct reading can still be unrepresentative. If one measurement location is directly under a branch cluster, next to a row intersection, or near a trunk, that field of view may contain less open sky than the overall stand.
The CI-110 can calculate LAI across multiple size classes and canopy parameters, but the result is only as representative as the sampling point.
5. PAR-based and image-based results are being compared without accounting for method differences
The CI-110 can estimate leaf area index using hemispherical images or its 24 PAR photodiodes. Those methods are related, but they are not identical in how they respond to sky conditions, canopy architecture, and sunflecks.
If you compare one method to another without standardizing time of day and conditions, the image-based value may look unexpectedly high.
How to check the CI-110 instrument in the field
When leaf area index values look too high, do a quick instrument check before collecting more data. This saves time and prevents a full day of questionable measurements.
Step 1: Inspect the lens and filter setup
Check the camera lens for dust, smudges, water spots, or scratches. Then confirm the correct neutral density filter is installed for the light conditions. A dirty lens or poor filter match can change contrast and thresholding performance.
Look at the live image on the touchscreen and ask:
- Is the canopy outline clear?
- Are open sky regions distinct?
- Is there glare or washed-out brightness?
- Are shadows too deep to separate canopy from background?
If the image is not clean, fix that first.
Step 2: Confirm leveling and capture stability
The CI-110 uses a self-leveling digital camera, but it is still worth confirming the unit is stable during image capture. Use the trigger carefully and take advantage of the delayed trigger release when needed to avoid motion blur or slight movement during acquisition. Crisp images matter because small classification errors add up in leaf area index calculations.
Step 3: Review zenith, azimuth, and processing settings
The instrument allows a full user-selectable range of zenith and azimuth angles, digitally applied. Make sure those settings are consistent with your protocol and previous measurements.
A changed analysis range can alter the canopy area included in the calculation and make current values look too high relative to older data.
Also verify:
- thresholding method
- RGB channel settings
- image vs PAR measurement mode
- canopy class settings if your workflow uses them
Step 4: Compare image-based and PAR-based readings
Because the CI-110 includes 24 PAR sensors in the instrument arm, you can cross-check the canopy with an alternative LAI measurement path. This is one of the most useful diagnostic steps. If both methods trend high, the canopy may truly be dense.
If only the image-based result is high, the issue is more likely tied to image quality or processing settings.
Step 5: Check GPS, compass, and orientation consistency
The CI-110 includes location data via GPS, GLONASS, BeiDou, and Galileo, along with an internal compass for standardizing measurements across locations. These features do not directly calculate leaf area index, but they help keep your sampling pattern and instrument orientation consistent.
If repeat measurements are drifting because orientation changes from point to point, data spread can widen and some values may trend artificially high.
A simple troubleshooting routine that works
When readings look off, use this sequence:
- Clean the lens and verify the filter.
- Capture a test image and inspect canopy-sky separation.
- Recheck thresholding and RGB settings.
- Confirm zenith and azimuth settings match your protocol.
- Repeat the measurement a few steps away from the original location.
- Compare image-based and PAR-based leaf area index estimates.
- Save the image and data for later review rather than relying only on the calculated number.
That last step matters. One of the strengths of the CI-110 is that image and data are visible in the field and saved for further analysis. That makes it easier to distinguish a true canopy signal from a processing issue.
Why CID Bio-Science gives users an advantage here
This is where instrument design really matters. With some canopy tools, troubleshooting high leaf area index values means guessing what happened during capture and hoping the data are usable.
The CI-110 gives researchers more ways to verify what they measured. The self-leveling camera, touch screen review, selectable thresholding methods, adjustable RGB values, PAR sensors, internal compass, and saved image workflow all help users check the measurement rather than just accept the output.
That is a practical advantage when you are working across variable field conditions and need confidence in the result.
The Bottom Line
Unexpectedly high leaf area index readings usually come from image classification, lighting, sampling position, or setup inconsistencies before they come from hardware failure.
In most cases, a quick review of lens condition, filter choice, image quality, threshold settings, and measurement mode will show where the problem started. The CI-110 Plant Canopy Imager is built to make that process easier by combining hemispherical imaging, PAR sensing, field review, and saved data in one instrument.
If you want a canopy imaging system that helps you collect leaf area index data and verify it on the spot, CID Bio-Science is worth a closer look. Explore the CI-110 and the rest of the CID Bio-Science plant research line to build a workflow that is faster, more consistent, and easier to trust in the field.
Related Products
Most Popular Articles
- Transpiration in Plants: Its Importance and Applications
- Leaf Area – How & Why Measuring Leaf Area…
- How to Analyze Photosynthesis in Plants: Methods and Tools
- Plant Respiration: Its Importance and Applications
- The Forest Canopy: Structure, Roles & Measurement
- Stomatal Conductance: Functions, Measurement, and…
- Forest & Plant Canopy Analysis – Tools…
- Root Respiration: Importance and Applications
- The Importance of Leaf Area Index (LAI) in…
- 50 Best Universities for Plant Science