How Light Fluorescence Ratios Help Detect Plant Stress Before Symptoms Appear
Dr. Vijayalaxmi Kinhal
February 2, 2026 at 5:33 pm | Updated February 2, 2026 at 5:33 pm | 8 min read
- Plant leaves fluoresce red, far-red, blue, and green under varying wavelengths of light.
- Chlorophyll fluorescence-based ratios include Fv/Fm and the red-to-far-red ratio.
- Fluorescence from red, far-red, blue, and green light occurs in response to UV light.
- Blue-to-red and blue-to-far-red ratios are more sensitive to stress than the chlorophyll fluorescence ratio of red/far-red.
Plants do not use all the light intercepted by the leaves. Some is lost as heat, and the rest is emitted back as fluorescence in various wavelengths. Ratios of fluorescence at different wavelengths are used in research, precision agriculture, and forestry to detect biotic and abiotic stresses that plants experience. In this article, you can learn about the standard fluorescence ratios and their applications.
What is Fluorescence
When materials absorb light of a certain color and emit light of another color, this process is called fluorescence. The light emitted back has less energy than the absorbed light due to energy loss in the process. Plants and animals can fluoresce, and the color emitted depends on the compounds involved.
The fluorescence commonly observed in plants is chlorophyll fluorescence. Chlorophyll fluoresces red and far-red light, depending on the amount of light left unused by photosynthesis. Because many stresses directly or indirectly affect photosynthesis, chlorophyll fluorescence has been widely used as an indicator of plant health and productivity. However, plants also fluoresce blue and green light, which can be used as stress indicators.
Subscribe to the CID Bio-Science Weekly article series.
By submitting this form, you are consenting to receive marketing emails from: . You can revoke your consent to receive emails at any time by using the SafeUnsubscribe® link, found at the bottom of every email. Emails are serviced by Constant Contact
Chlorophyll Fluorescence
Chlorophyll fluorescence (ChF) is the light emitted by chlorophyll a in the chloroplasts occurring in the leaf mesophyll tissue. Chlorophyll a is present in both photosystems, PS I and PS II, where it absorbs light at 700 nm and 680 nm, respectively.
Two types of chlorophyll fluorescence ratios are used to detect stress and plant health. These are the Fv/Fm ratio and the red-to-far-red ratio.
The Fv/Fm ratio: In the dark, when no light strikes the leaves, the fluorescence from PSII is at a minimum or F0. When leaves are exposed to pulsating light, fluorescence reaches a maximum Fm. The difference between F0 and Fm gives Fv. The Fv/Fm ratio indicates the photosynthetic rate; it is high in healthy leaves and reduced under stress. Hence, this ratio is used to measure photosynthetic efficiency and also to indicate stress.
The red to far-red ratio: Chlorophyll fluorescence in red color or 687 nm occurs in PSII, and far-red fluorescence or 760 nm occurs in PSI. When leaves are stressed, generally, chlorophyll fluoresces more red light because photosynthesis occurs less frequently, increasing the red-to-far-red ratio.
Applications of chlorophyll fluorescence
The two chlorophyll fluorescence techniques can be used to detect plant stress caused by drought, freezing, chilling, nutrient deficiency, salinity, ozone, heavy metal pollution, fungal and viral diseases, wounding, and UV radiation. Early detection of plant stress is possible using these ratios in precision agriculture and forestry, even before visual symptoms appear, helping maintain plant health and productivity.
- Nutrient deficiency: Nitrogen is essential for chlorophyll formation. Hence, nitrogen deficiency will negatively impact photosynthesis and can be detected by changes in the Fv/Fm ratio. It is applied in precision agriculture to provide information on site-specific nitrogen needs, helping reduce the overuse of chemical fertilizers.
- Water stress: Plant water stress reduces the photosynthetic rate, which can be detected by chlorophyll fluorescence. However, the Fv/Fm ratio is not very sensitive to severe water stress. The red-to-far-red ratio is low, indicating an air-water deficit rather than a soil-water deficit. So, chlorophyll fluorescence is not suitable for irrigation guidance in agriculture.
- Diseases: Chlorophyll fluorescence can detect and quantify disease incidence and damage caused by different biotic stressors.
- Temperature stress: Both excess and cold temperatures affect plants. At high temperatures, photosynthetic activity is reduced, resulting in a low Fv/Fm ratio. The red-to-far-red ratio is also low in heat stress. Cold temperatures lower the Fv/Fm ratio, indicating chilling and freezing stress, but increase the red-to-far-red ratio.
- Herbicide toxicity: Using chemical herbicides alters plant metabolism, directly or indirectly influencing photosynthesis and the fluorescence ratios. Applying excessive herbicides can significantly increase the chlorophyll fluorescence red-to-far-red ratio.
- Salinity: Salt stress reduces and alters chlorophyll in leaves to affect the photosynthetic ratio. So, the red-to-far-red ratio increases.
Changes in the chlorophyll fluorescence red-to-far-red ratio can be measured at field and remote-sensing scales.
Blue-Green Fluorescence
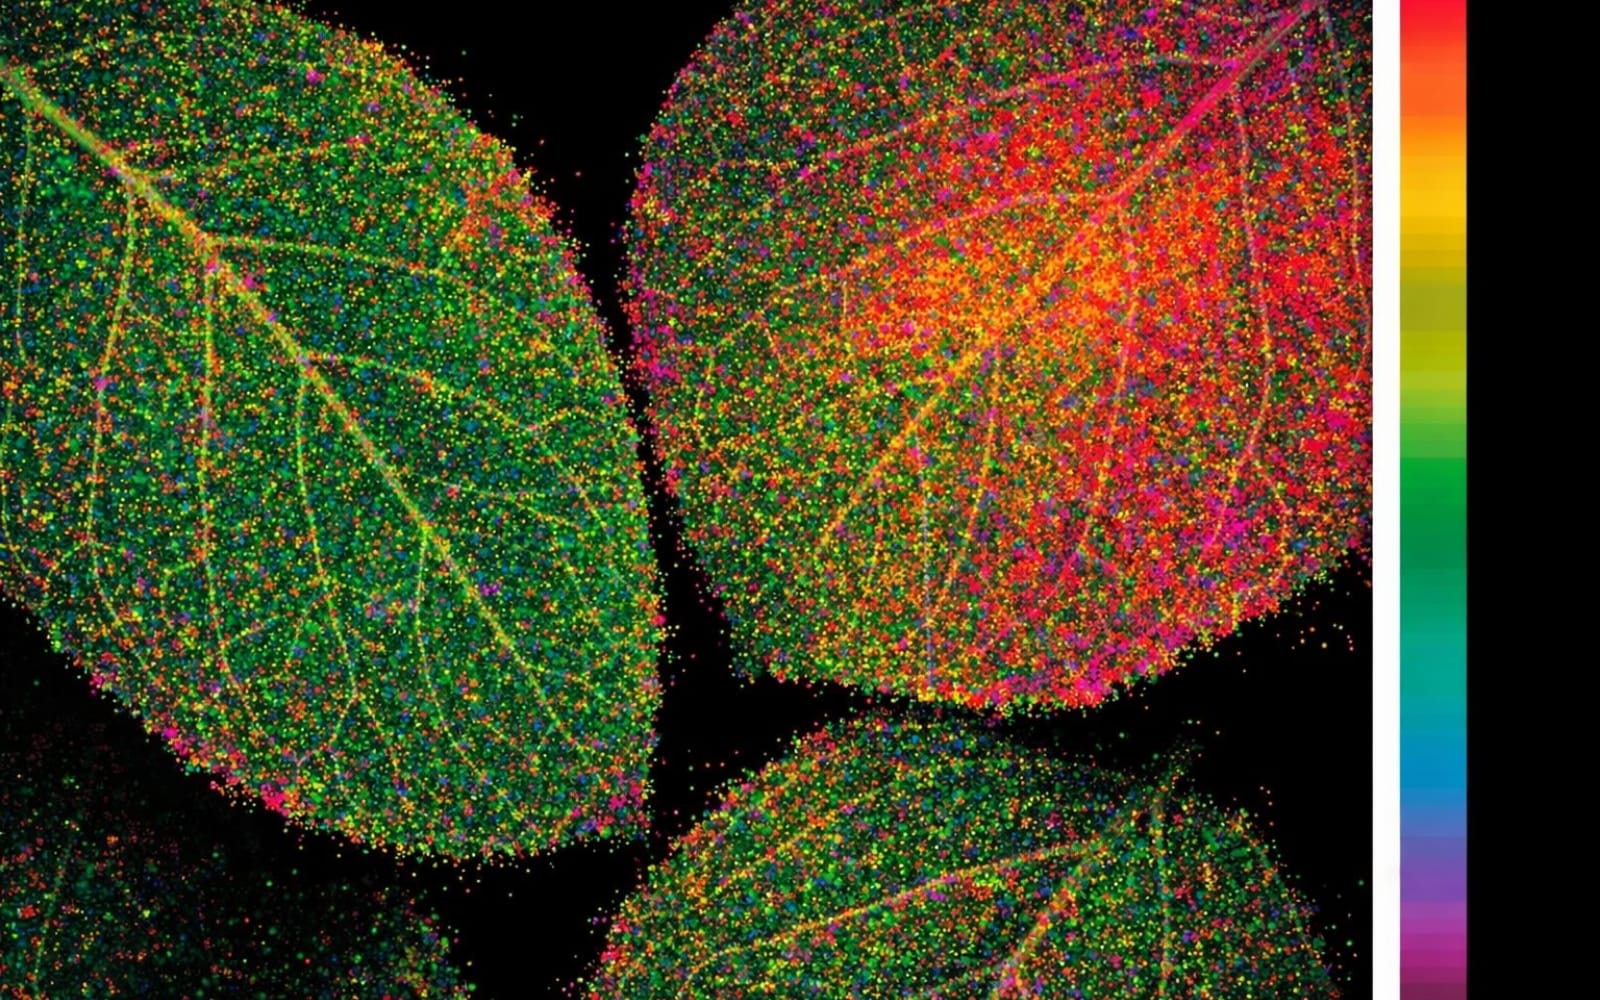
Plants also show red (690 nm) and far-red (740 nm) fluorescence in response to ultraviolet (UV) light, and the phenomenon is common in dicots and vein-free areas of a leaf, as shown in Figure 1. The compounds involved are again chlorophyll a in the chloroplasts; see Table 1.
Red and far-red fluorescence is strong in light-green leaves. As chlorophyll concentration increases, emission at 690 nm (red) decreases due to reabsorption by chlorophyll proteins in the thylakoid membrane, thereby lowering the red-to-far-red ratio. Thus, the red-to-far-red ratio can be used as an indicator of chlorophyll content in leaves.
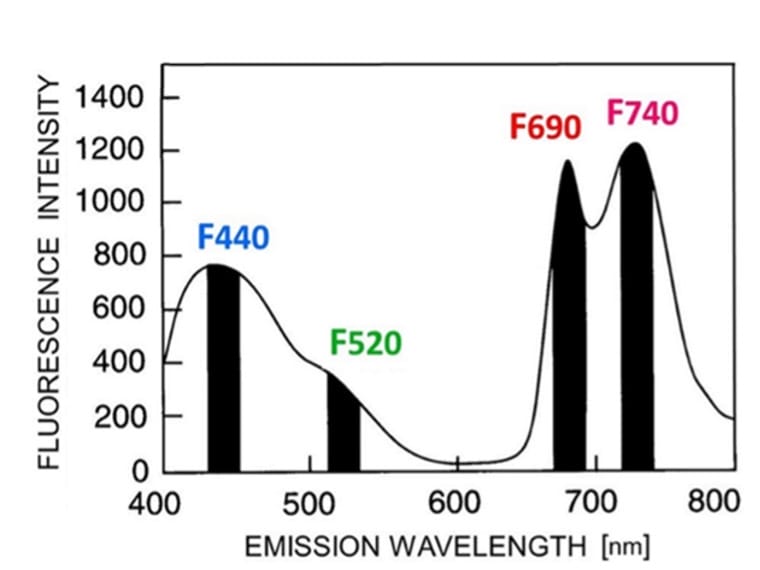
Figure 1: “Fluorescence emission spectrum of an aurea-green tobacco leaf (upper leaf side) excited by UV-A radiation (λ =355 nm) in a Perkin-Elmer spectrofluorometer. The four
fluorescence bands in the blue (F440), green (F520), red (F690), and far-red (F740) spectral region are marked here as black bars,” Lichtenthaler (2021). (Image credits: DOI 10.32615/ps.2021.020)
When UV-A radiation is used, it does not penetrate into the leaf tissue. The compounds in the epidermal cells absorb light and fluoresce. These are in the colors green and blue. There is a broad blue band starting from 430 to 445 nm, with a lower shoulder at 520 to 530 nm (green), as shown in Figure 1. The blue and green fluorescence is more stable than the variable red and far-red chlorophyll-based fluorescence.
In dicots, where light is absorbed by chloroplasts, emission of blue and green is low. This phenomenon also results in a difference in fluorescence between the two sides of the leaves. There is less fluorescence in red, blue, and green light on the upper sides of dicot leaves, which have more chlorophyll. Higher red and blue fluorescence is seen from the underside of leaves, due to the presence of less chlorophyll.
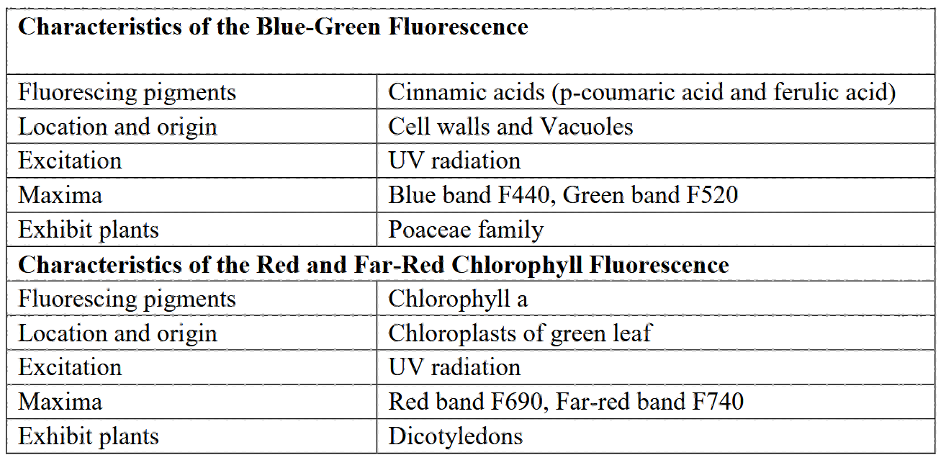
In contrast, in members of Poaceae and in chlorophyll-free veins and mid-veins, the blue-green fluorescence is higher than in dicots. The compounds fluorescing blue and green are cinnamic acids, p-coumaric acid, and ferulic acid, present in the cell wall and vacuoles in the cell plasma, as listed in Table 1. Nicotinamide Adenine Dinucleotide Phosphate (NADP), a compound found in chloroplasts, and certain secondary compounds formed during stress and aging, also increase blue-green fluorescence.
According to Lichtenthaler (2021), single-point measurements of fluorescence can give
blue-to-red, blue-to-far-red, and blue-to-green ratios, in addition to the red-to-far-red ratio, which can be used to detect plant stress. The blue-to-red and blue-to-far-red ratios are very sensitive to environmental stress. These ratios can also vary among species.
Table 1: “Characteristics of the blue-green and red and far-red chlorophyll fluorescence,” Yadav et al. (2017). (Image credits: http://dx.doi.org/10.20546/ijcmas.2017.604.068)
Applications of blue-green fluorescence
The blue-green fluorescence can be used for non-destructive detection of nitrogen deficiency, water stress, heat stress, high-light stress, herbicide stress, and biotic stress.
Nutrient deficiencies: When minerals, especially nitrogen, are lacking, there is less chlorophyll; therefore, the blue-green fluorescence is higher, producing higher blue-to-red and blue-to-far-red ratios, which can be stronger than the red-to-far-red chlorophyll fluorescence ratios, as shown in Figure 2. Zinc and nitrogen deficiencies have been detected in wheat plants using this method. Nitrogen, potassium, and phosphorus stress have been detected in sunflower plants, too.
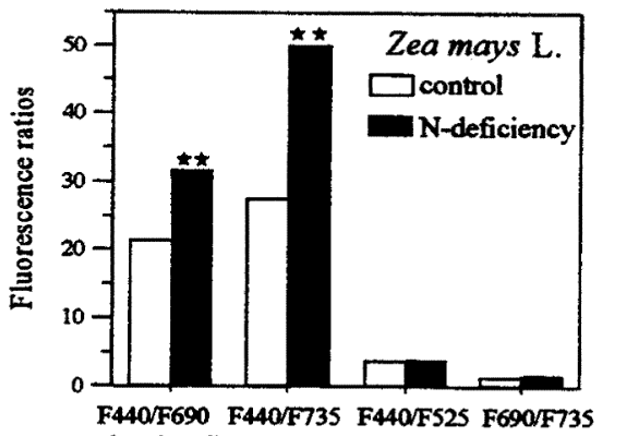
Figure 2: “Differences in the fluorescence ratios blue/red (F440/F690) and blue/far-red (F440/F725), red/far-red (F690/F735), and blue/green (F440/F725) in a green maize leaf control and a leaf from a N-deficient maize plant,” Lichtenhaler, et al. (1997). (Image credits: DOI: 10.1109/IGARSS.1997.609078)
Water stress: Water stress increases the green-to-red and green-to-far-red ratios. However, the blue-to-red, blue-to-far-red, and blue-to-green ratios are stronger, as shown in Figure 3. These blue ratios are also more suitable indicators of water stress in plants than chlorophyll fluorescence ratios, which are not suitable for detecting water stress.
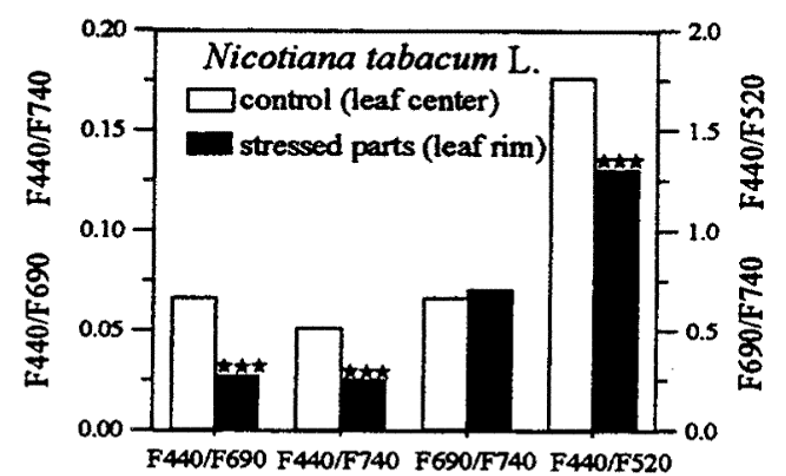
Figure 3: “Differences in fluorescence ratios blue/red, Blue/far-red and red/far-red and blue/green between control (central leaf parts) and heat and water stressed leaf parts (lateral and leaf rim) of a tobacco leaf treated at 40 °C for six hours,” Lichtenhaler, et al. (1997). (Image credits: DOI: 10.1109/IGARSS.1997.609078)
Highlight: In plants exposed to high light, blue and green fluorescence increase compared to plants in shade. The red and far-red fluorescence are lowered due to UV light absorption by flavonols that accumulate in response to exposure to UV light. As a result, the blue-to-red and blue-to-far-red ratios are significantly higher than in controls and are suitable as indicators of high light.
Insect attack: Plants attacked by insects show an increase in fluorescence ratios of blue-to-red and blue-far-red before visual symptoms are observed.
Herbicide stress: Applying excessive herbicides decreases the blue-to-red and blue-to-far-red ratios.
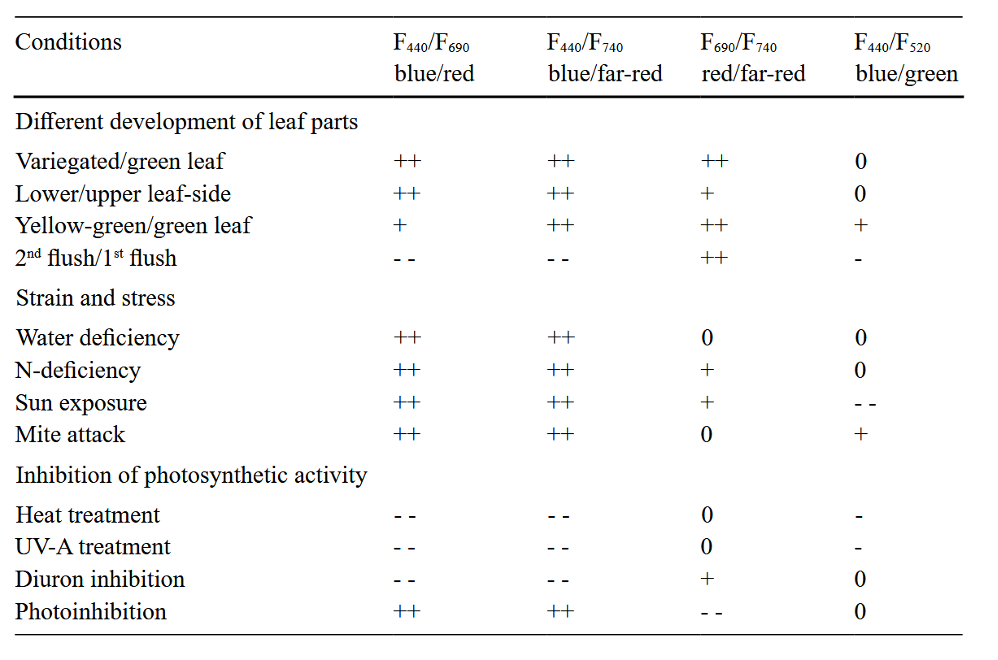
Although green fluorescence is present, because blue fluorescence is stronger, its ratio to red and far-red fluorescence is a more reliable indicator of stress. Blue to red and far-red ratios are also stronger and better indicators of stress than the chlorophyll fluorescence red-to-far-red ratio. See Table 2 for detailed comparisons.
Table 2. “Differences in the fluorescence ratios of blue/red (F440/F690), blue/far-red (F440/F740), red/far-red (F690/F740), and blue/green (F440/F520) between different types of leaves, developmental stages, as well as strain and stress conditions, including partial inhibition of photosynthetic activity. The table is based on the multiple results obtained by fluorescence imaging of leaves and plants. (++: strong rise; +: rise; – -: strong decrease; -: decrease; 0: no significant change of the fluorescence ratio),” Lichtenthaler (2021). (Image credits: DOI 10.32615/ps.2021.020)
Measuring the Fluorescence Ratios
In the field, chlorophyll fluorescence can be measured nondestructively using instruments such as the CI-340 Handheld Photosynthesis System. Remote sensing imagery can also measure sun-induced fluorescence.
The blue and green fluorescence can be measured in the field using tools such as the CI-710s SpectraVue Leaf Spectrometer by CID BioScience Inc., which nondestructively collects and analyzes spectra in real time. The spectrometer can use spectra to calculate built-in indices, such as the Lichtenthaler Index 1 (red-to-far-red ratio) and Lichtenthaler Index 2 (blue-to-red fluorescence ratio), or new indices that can be added to suit research needs, saving time and effort.
Contact us at Bio-Science Inc. to learn more about the CI-340 Handheld Photosynthesis System and CI-710s SpectraVue Leaf Spectrometer for your plant fluorescence and stress research.
Sources
Lang M., Stober F., Lichtenthaler H.K.: Fluorescence emission spectra of plant leaves and plant constituents. – Radiat. Environ. Bioph. 30: 333-347, 1991. DOI: 10.1007/BF01210517
Lichtenthaler, H. K., Subhash, N., Wenzel, O., & Miehé, J. A. (1997, August). Laser-induced imaging of blue/red and blue/far-red fluorescence ratios, F440/F690 and F440/F740, as a means of early stress detection in plants. In IGARSS’97. 1997 IEEE International Geoscience and Remote Sensing Symposium Proceedings. Remote Sensing-A Scientific Vision for Sustainable Development (Vol. 4, pp. 1799-1801). IEEE.
Lichtenthaler, H. K. (2021). Multi-colour fluorescence imaging of photosynthetic activity and plant stress. Photosynthetica, 59(2), 4-20.
Russel, A.P., and Endow, S.A. (2016). Lesson Plan: Fluorescence. Retrieved from https://www.biophysics.org/Portals/0/BPSAssets/Education/Documents/LessonPlanFluorescence.pdf
Subhash, N., Wenzel, O., & Lichtenthaler, H. K. (1999). Changes in blue-green and chlorophyll fluorescence emission and fluorescence ratios during senescence of tobacco plants. Remote Sensing of Environment, 69(3), 215-223.
Yadav, B., Kumawat, C., Verma, A. K., Yadav, D. K., & Yadav, P. (2017). Fluorescence imaging for crop stress monitoring: A review. Int. J. Curr. Microbiol. Appl. Sci, 6, 568-575.
Related Products
Most Popular Articles
- Transpiration in Plants: Its Importance and Applications
- Leaf Area – How & Why Measuring Leaf Area…
- How to Analyze Photosynthesis in Plants: Methods and Tools
- Plant Respiration: Its Importance and Applications
- The Forest Canopy: Structure, Roles & Measurement
- Stomatal Conductance: Functions, Measurement, and…
- Forest & Plant Canopy Analysis – Tools…
- Root Respiration: Importance and Applications
- The Importance of Leaf Area Index (LAI) in…
- 50 Best Universities for Plant Science