5 Software Tools Compatible with Canopy Image Analysis
Scott Trimble
June 18, 2026 at 5:14 pm | Updated June 18, 2026 at 5:14 pm | 4 min read
Canopy image analysis software plays a central role in turning field images into usable, quantitative data. Whether you are calculating leaf area index, measuring gap fraction, or modeling light interception, the quality of your analysis depends on both the instrument and the software you choose. For researchers using the CI-110 Plant Canopy Imager, selecting the right canopy image analysis software ensures that hemispherical images translate into defensible, repeatable results.
Below are five software tools commonly used alongside hemispherical photography and canopy imaging systems. Each offers a different approach to processing canopy images, and all can complement data collected in the field with the CI-110.
CI-110 Plant Canopy Imager Software
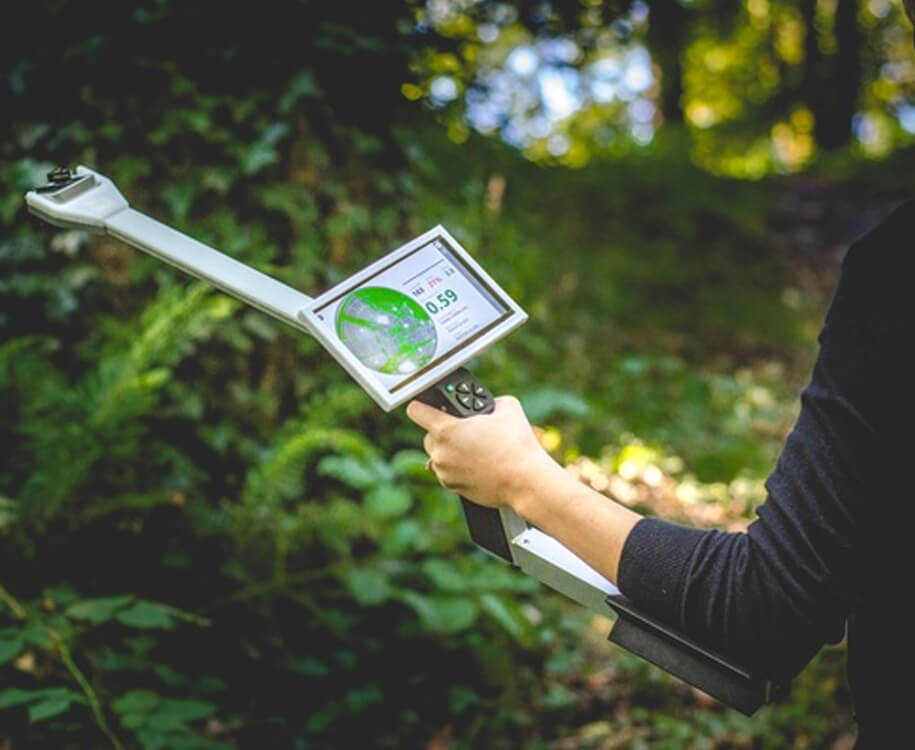
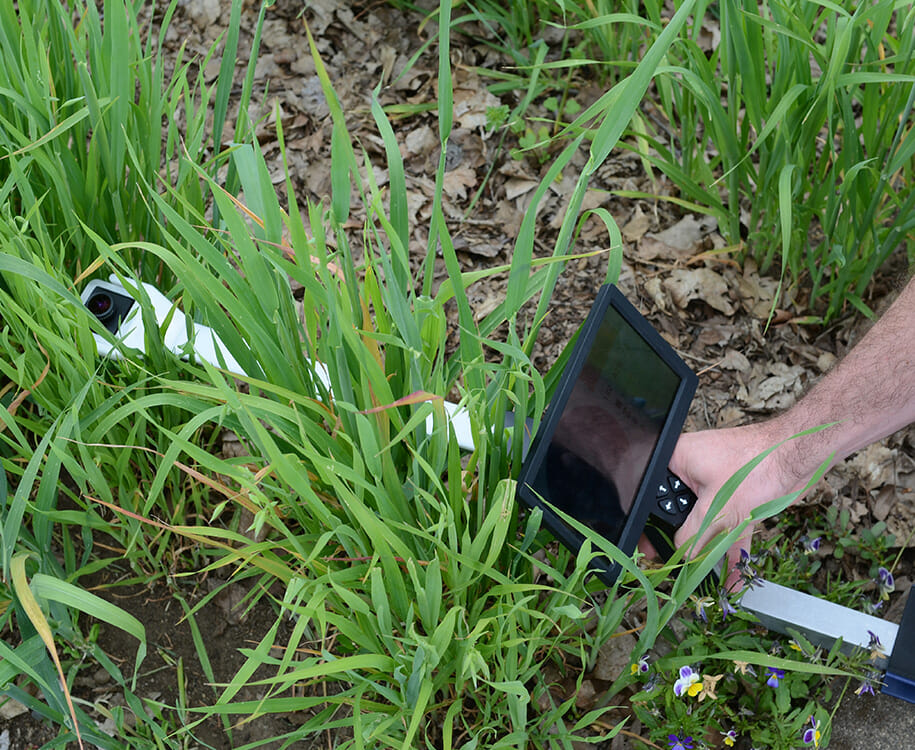
The CI-110 Plant Canopy Imager integrates canopy image analysis software directly into the instrument. This matters in real-world fieldwork. Instead of capturing images and waiting to process them later, researchers can calculate leaf area index and canopy parameters immediately on site.
Subscribe to receive our monthly round-up of articles.
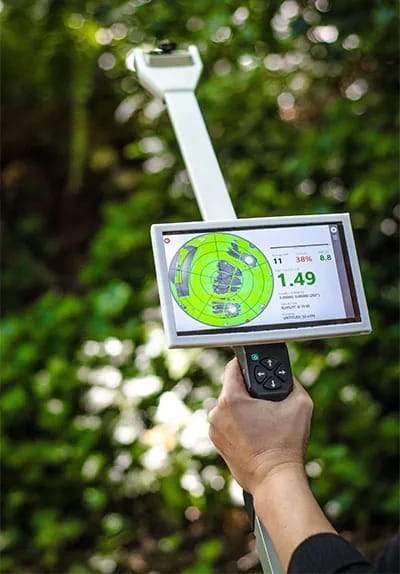
The CI-110 combines hemispherical canopy photography with 24 PAR sensors to support both image-based and radiation-based LAI measurements . Its self-leveling digital camera captures 150 degree field-of-view images for hemispherical analysis. Built-in thresholding options, including the Otsu Method and Entropy Crossover Technique, allow users to apply literature-supported segmentation methods directly in the field.
Key advantages include:
-
On-board LAI calculation without above-canopy reference readings
-
Adjustable zenith and azimuth angle ranges applied digitally
-
Immediate image review on a 7 inch capacitive touchscreen
-
GPS integration across multiple satellite constellations for accurate location tagging
Because the canopy image analysis software is integrated, there is no disconnect between data capture and processing. This reduces post-processing time and limits variability introduced by exporting to third-party platforms.
For researchers who need fast, repeatable LAI data under varying sky conditions, the CI-110 provides a complete hardware and software solution in one unit.
Hemisfer
Hemisfer is a well-known canopy image analysis software package designed specifically for hemispherical photographs. It allows users to compute leaf area index, gap fraction, and radiation transmission from fisheye images.
Researchers typically use Hemisfer in workflows where images are captured in the field and processed later on a desktop system. The software provides flexible thresholding controls and supports multiple projection types, which can be useful for advanced canopy structure modeling.
However, Hemisfer requires careful calibration and manual input of site parameters. In contrast, integrated systems like the CI-110 automate many of these steps at the point of capture. That difference becomes important when working across multiple field sites where consistency is critical.
Gap Light Analyzer
Gap Light Analyzer, often referred to as GLA, is another canopy image analysis software tool widely used in forest ecology. Developed to quantify canopy structure and understory light environments, GLA processes hemispherical photographs to estimate LAI and transmitted radiation.
GLA is frequently used in academic settings and long-term ecological monitoring studies. It supports detailed radiation modeling, which can be valuable in forest dynamics research.
That said, it relies heavily on user-defined inputs and post-field processing. When using standalone image files, researchers must manage metadata, camera calibration factors, and exposure consistency separately. With instruments like the CI-110, much of this standardization is handled internally during image capture. This reduces the risk of variability caused by inconsistent camera setup.
CAN-EYE
CAN-EYE is canopy image analysis software developed for vegetation structure and radiation studies. It supports both hemispherical photography and other remote sensing inputs. The platform is often used in research projects that integrate ground-based and satellite data.
One advantage of CAN-EYE is its ability to link canopy structure data with broader ecosystem models. For researchers working across scales, this can be useful.
However, CAN-EYE workflows generally require exporting field images and conducting processing in a separate analytical environment. Compared to field-ready solutions like the CI-110, this adds an extra layer of data management. When efficiency matters, integrated canopy image analysis software minimizes that overhead.
ImageJ with Canopy Plugins
ImageJ is an open-source image processing platform widely used in biological research. With specialized plugins, it can function as canopy image analysis software for hemispherical images.
This approach appeals to researchers who prefer open-source customization. Users can script thresholding routines, batch process images, and modify analysis pipelines.
The tradeoff is that ImageJ requires significant setup. Users must ensure correct fisheye calibration, angular masking, and threshold validation. Without standardized hardware integration, consistency can vary between operators.
In contrast, the CI-110 system standardizes capture conditions with a self-leveling camera and selectable thresholding methods built into the device. That integration reduces user-dependent variability and improves repeatability across teams.
Why Integrated Canopy Image Analysis Software Matters
All five canopy image analysis software options can produce publishable results when used correctly. The real distinction lies in workflow efficiency, data consistency, and integration with hardware.
The CI-110 stands out because it merges:
-
Hemispherical image capture
-
Built-in PAR sensing with 24 photodiodes
-
Immediate LAI calculation
-
Field-visible data validation
-
GPS-tagged measurements
Researchers do not need to collect above-canopy reference readings for gap fraction LAI. Images and computed data are visible and saved directly in the field. That streamlines multi-site projects and reduces post-processing time.
For teams managing seasonal campaigns, long-term ecological monitoring, or agricultural field trials, these efficiencies translate directly into better data integrity.
How Canopy Imaging Fits into a Broader Measurement Strategy
Canopy image analysis software becomes even more powerful when paired with complementary plant measurement tools.
For example:
-
Leaf-level measurements from the CI-202 Portable Laser Leaf Area Meter provide high-resolution area data with 0.01 cm² resolution.
-
The CI-203 Handheld Laser Leaf Area Meter enables rapid, non-destructive measurements with GPS tagging and unlimited SD storage.
-
The CI-340 Handheld Photosynthesis System measures gas exchange, including photosynthesis, transpiration, and stomatal conductance, with optional control modules for light and CO2.
By combining canopy-level LAI data with leaf-level area measurements and gas exchange data, researchers can link structure with function. That integrated approach strengthens experimental conclusions and improves model accuracy.
Takeaway: Upgrade Your Canopy Image Analysis Workflow
If you are evaluating canopy image analysis software for your next project, consider whether your current workflow adds unnecessary processing steps. The CI-110 Plant Canopy Imager delivers integrated canopy image analysis software directly in the field, along with PAR sensing and GPS-enabled data logging .
Visit CID Bio-Science to learn how the CI-110 can simplify your canopy measurement workflow while improving consistency and data quality. Field-ready tools make a measurable difference.
Related Products
Most Popular Articles
- Transpiration in Plants: Its Importance and Applications
- Leaf Area – How & Why Measuring Leaf Area…
- How to Analyze Photosynthesis in Plants: Methods and Tools
- Plant Respiration: Its Importance and Applications
- The Forest Canopy: Structure, Roles & Measurement
- Stomatal Conductance: Functions, Measurement, and…
- Forest & Plant Canopy Analysis – Tools…
- Root Respiration: Importance and Applications
- The Importance of Leaf Area Index (LAI) in…
- 50 Best Universities for Plant Science